Gold Price Forecast: XAU/USD remains vulnerable while below strong $1750 cap – Confluence Detector
- Gold price rebounds but downside bias remains intact.
- Treasury yields retreat, although Fed’s hawkishness will cap gold price.
- Gold remains vulnerable amid hawkish Fed outlook.
The stabilization in the US bond markets seems to have helped gold price staged a tepid recovery, with the 10-year Treasury yields reversing to 1.50% levels. The return of risk appetite, despite the looming energy crisis and China Evergrande concerns, limits the US dollar’s upside. However, the rebound in gold price appears shallow, as the Fed’s hawkish sentiment and rising inflation expectations will likely revive the bullish undertone in the yields, rendering negative for the non-interest-bearing gold.
Read: Gold Price Forecast: XAU/USD set to test $1700? Daily close below 61.8% Fib level flags caution
Gold Price: Key levels to watch
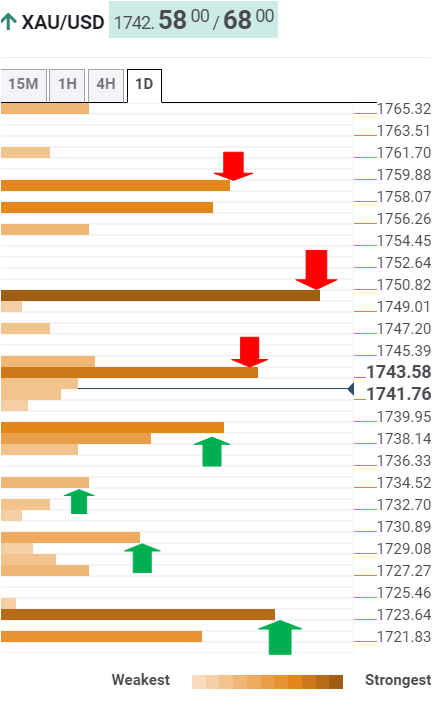
According to the Technical Confluences Detector, gold is challenging $1743 on its road to recovery. That level is the convergence of the SMA50 one-hour, Fibonacci 61.8% one-day and Fibonacci 38.2% one-month.
Acceptance above the latter could trigger a fresh advance to test the powerful hurdle at $1750, the confluence of the SMA5 one-day, Fibonacci 23.6% one-week and pivot point one-day R1.
Gold bulls will then challenge the previous day’s high at $1755, where the Fibonacci 38.2% one-week coincides with the SMA50 four-hour.
The next relevant upside target is aligned at the SMA10 one-day of $1759.
On the flip side, strong support is seen at $1738, the intersection of the Fibonacci 38.2% one-day and the previous week’s low.
The Fibonacci 23.6% one-day at $1734 will be the next line of defense for gold buyers.
If the selling pressure intensifies below the latter, then a test of the pivot point one-week S1 at $1730 will be in the offing.
The meeting point of the pivot point one-day S1 and pivot point one-month S1 at $1724 will be the level to beat for gold bears.
Here is how it looks on the tool
About Technical Confluences Detector
The TCD (Technical Confluences Detector) is a tool to locate and point out those price levels where there is a congestion of indicators, moving averages, Fibonacci levels, Pivot Points, etc. If you are a short-term trader, you will find entry points for counter-trend strategies and hunt a few points at a time. If you are a medium-to-long-term trader, this tool will allow you to know in advance the price levels where a medium-to-long-term trend may stop and rest, where to unwind positions, or where to increase your position size.