Gold Price Analysis: Target achieved and fresh bear-cycle lows for 2021
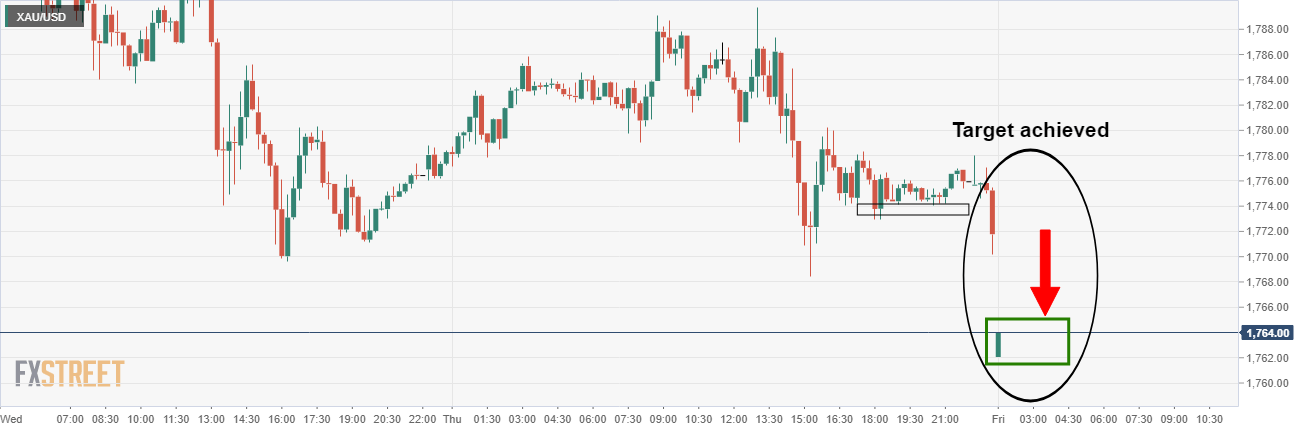
- Gold has dropped to 2021 lows and in doing so has completed another chapter of 'gold price analysis'.
- The support structure on an hourly basis finally caved in, making way for the $1,765 weekly target.
As per the prior analysis of Gold, Gold Price Analysis: Bears need break of current support for $1,765 target, stubborn bulls have finally given way to the weekly target and the price has printed a fresh cycle low for 2021.
Prior analysis
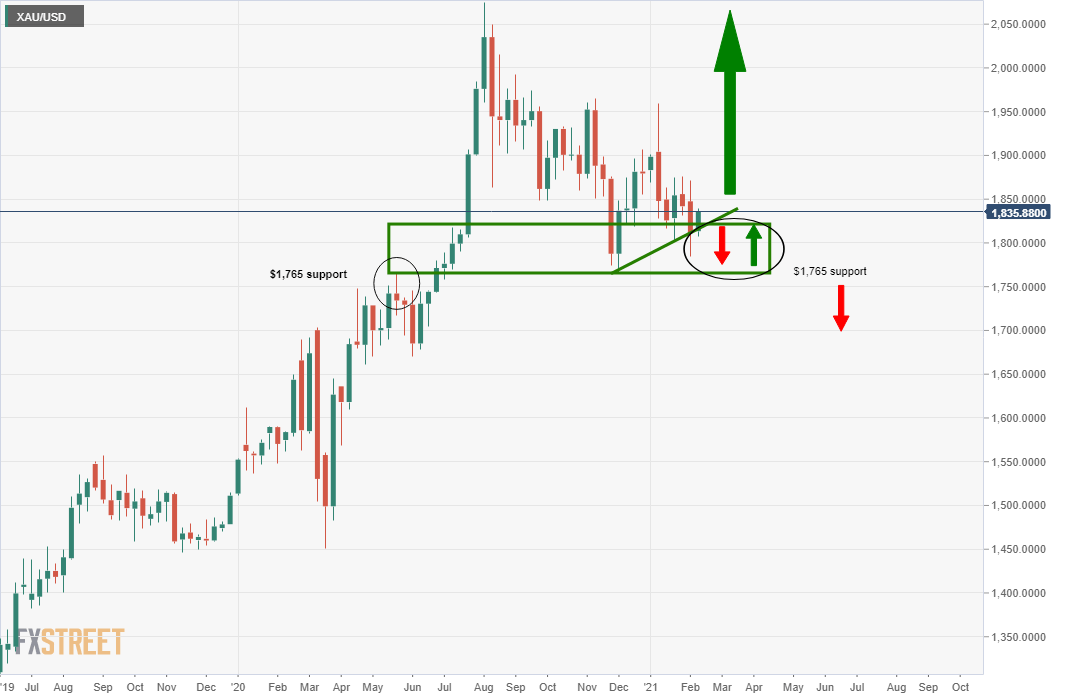
The weekly outlook was illustrated in the above chart from the original analysis from 9. Feb:
Gold Price Analysis: Bears to target a run to weekly support at $1,765
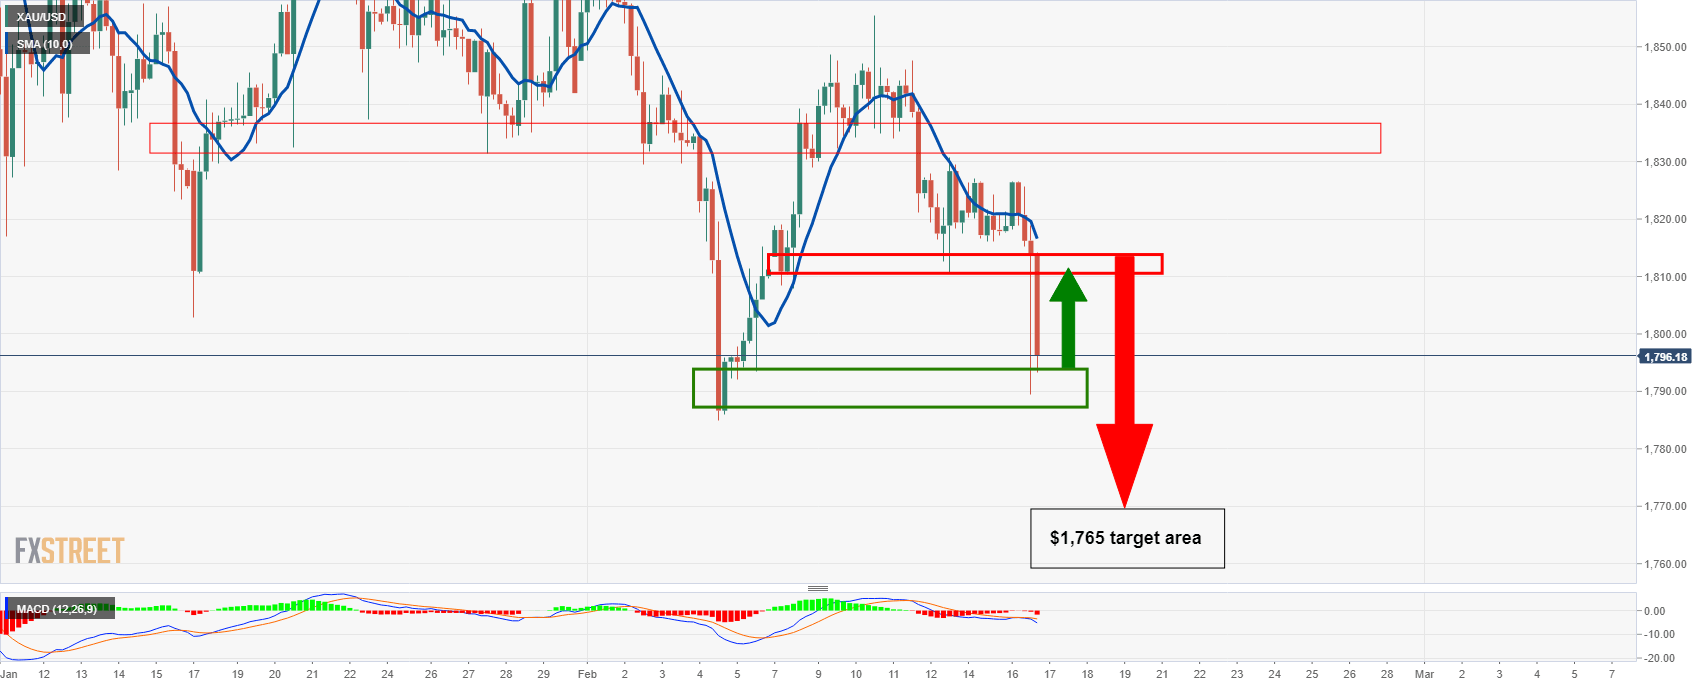
In more up to date analysis, Gold Price Analysis: Bears need break of current support for $1,765 target, from a 4-hour perspective tracking the progress of the price since the original article, the price had moved in the projected direction, running into support as follows:
Thereafter, the FOMC minutes arrived and helped prices along to the downside in bullish sentiment for the 2021 economic recovery:
Gold Price Analysis: XAU/USD vulnerable following bullish FOMC minutes
The hourly chart was then illustrating the bearish conditions for the conviction to the target as follows:
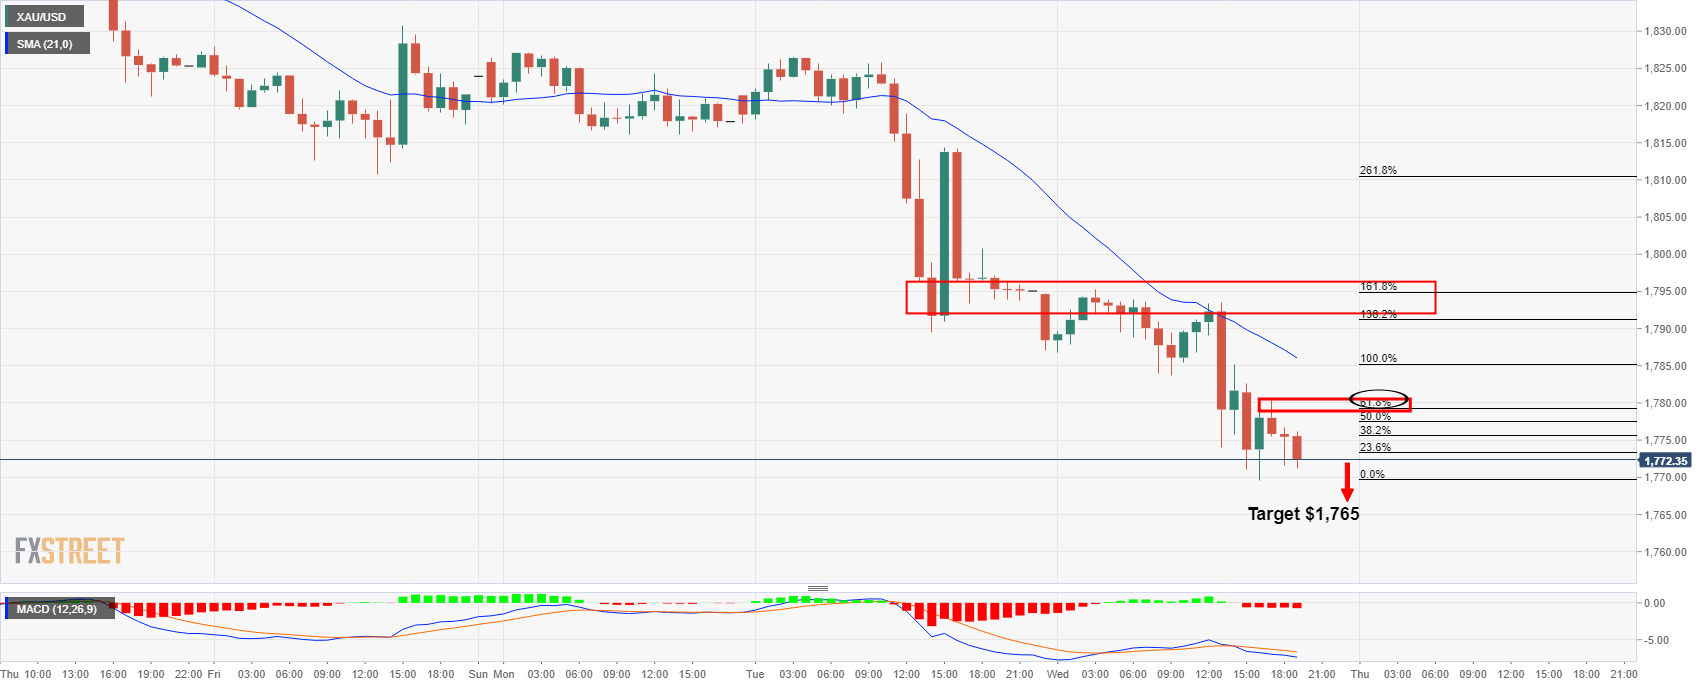
''Meanwhile, we have the last structure left to play out on the hourly chart where a 61.8% Fibonacci retracement of the latest hourly impulse has acted as a resistance.
This offers a -272% Fibonacci retracement of the correction's range to the $1,765 target and the price is already well on the way there.''
Live market, hourly chart
At this juncture, considering the weekly support, the price would now be expected to correct to the upside and restest the resistance of the $1,800 level again.
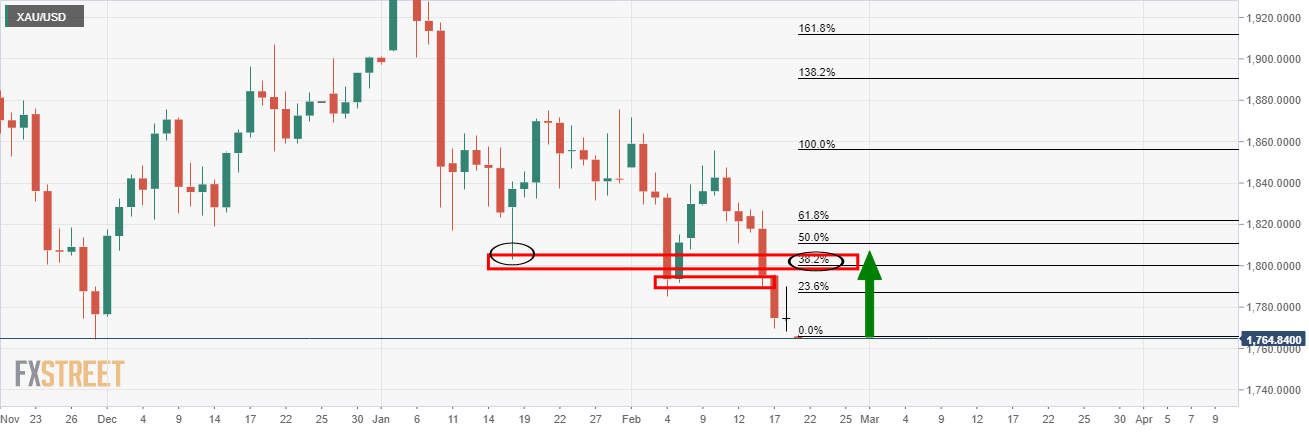
On the way there, $1,785 will be the first hurdle until the 38.2%, old support and psychological round number, $1,800, confluence.
If the price continues to run deeper into demand, then the $1,785 resistance will potentially align with the 38.2% Fibo of the daily bearish impulse instead of 1800.
In doing so, this will be firming $1,785 as a strong level of resistance and cementing the downside bias for lower lows and continuation of the bear trend.