Silver Price Analysis: XAG/USD sellers flirt with $19.00 at monthly low
- Silver price remains pressured at one-month low after six consecutive days of downside.
- Bearish MACD signals, downbeat RSI keeps sellers hopeful below weekly resistance line.
- 21-DMA adds to the upside filters, yearly low lures the XAG/USD bears.
Silver price (XAG/USD) fades corrective pullback from the monthly low marked the previous day as it renews its daily bottom around $18.95 during Tuesday’s Asian session. In doing so, the bright metal justifies the downbeat oscillators while extending the six-day downtrend below a one-week-old descending resistance line.
That said, the quote’s further weakness eyes the yearly low marked in July at around $18.20, before hitting the $18.00 threshold.
It’s worth noting that the XAG/USD weakness past $18.00 could quickly direct bears towards the 61.8% Fibonacci Expansion (FE) of late April to mid-August moves, around $17.45.
However, a convergence of the downward sloping support line from May 13 and 78.6% FE, near $16.60-50 could challenge the bears afterward.
Meanwhile, recovery moves need validation from the weekly resistance line, at $19.10 by the press time.
Following that, the 21-DMA and the monthly high could challenge the silver buyer at around $19.90 and $20.90 respectively.
It should be observed that the XAG/USD upside past $20.90 should provide a daily closing beyond the $21.00 round figure to recall the buyers.
Silver: Daily chart
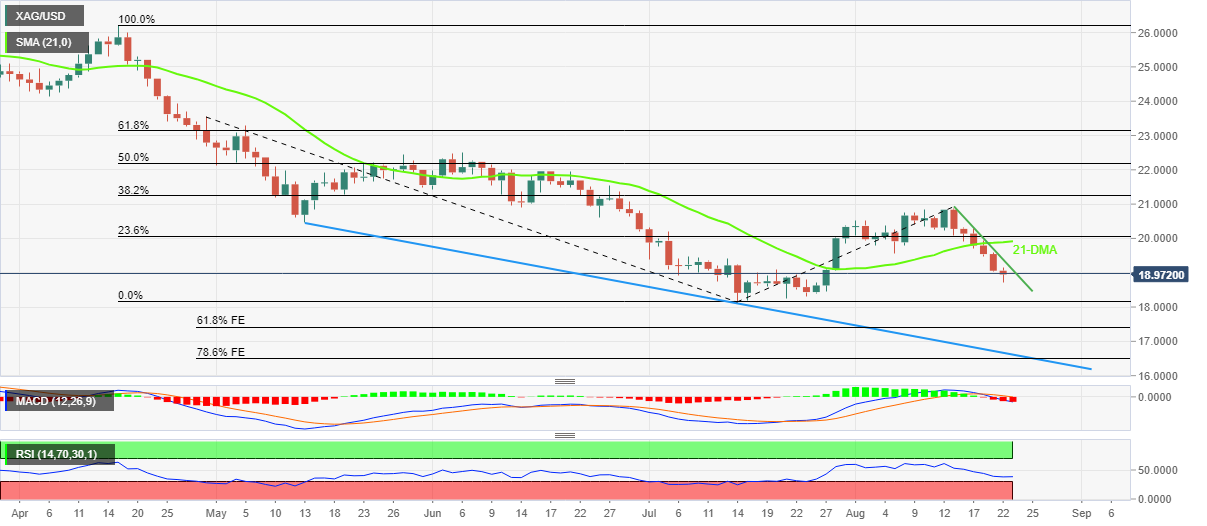
Trend: Further downside expected