GBP/USD Price Analysis: Keeps pullback from 20-DMA below 1.2000
- GBP/USD remains pressured after reversing from short-term key moving average.
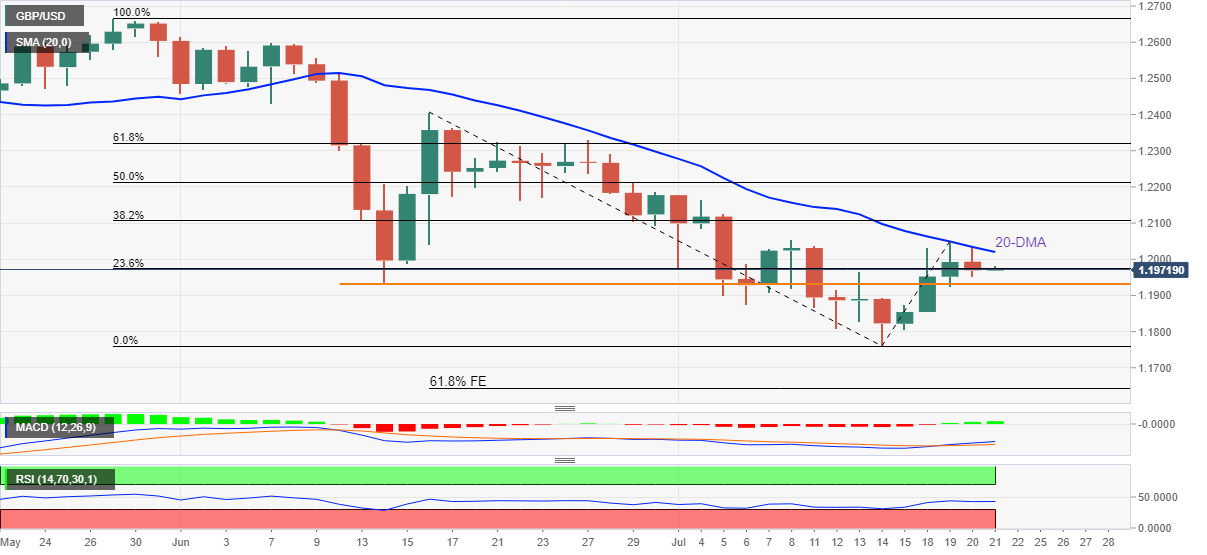
- Five-week-old horizontal support challenges immediate downside, bulls need validation from 1.2055.
- MACD signals, RSI (14) hint at further consolidation from yearly low.
GBP/USD holds onto the previous day’s pullback from the 20-DMA around 1.1970 amid Thursday’s Asian session.
In doing so, the Cable pair ignores MACD and RSI (14) as bears approach a horizontal support area established since June 14, around 1.1930.
The quote’s further downside appears limited as the 1.1900 threshold and 1.1880 level may test the bears before directing them to the two-year low around 1.1760, flashed last week.
It’s worth noting that the GBP/USD weakness past 1.1760 won’t hesitate to drag it towards the 61.8% Fibonacci Expansion (FE) of June 16 to July 19 moves, around 1.1650.
On the contrary, an upside break of the 20-DMA, at 1.2020 by the press time, isn’t a green signal to the Cable buyers as July 08 swing high near 1.2055 appears the short-term hurdle to the north.
Following that, the 38.2% Fibonacci retracement of the June-July downside, close to 1.2105, will precede the June 22 low of 1.2161 to challenge the GBP/USD buyers.
Overall, GBP/USD is likely to witness further downside but the road to the south is bumpy and long.
GBP/USD: Daily chart
Trend: Limited downside expected