GBP/USD Price Analysis: Bulls approach 1.2600, recovery needs validation from 50-DMA
- GBP/USD grinds higher after staging notable rebound from three-week low.
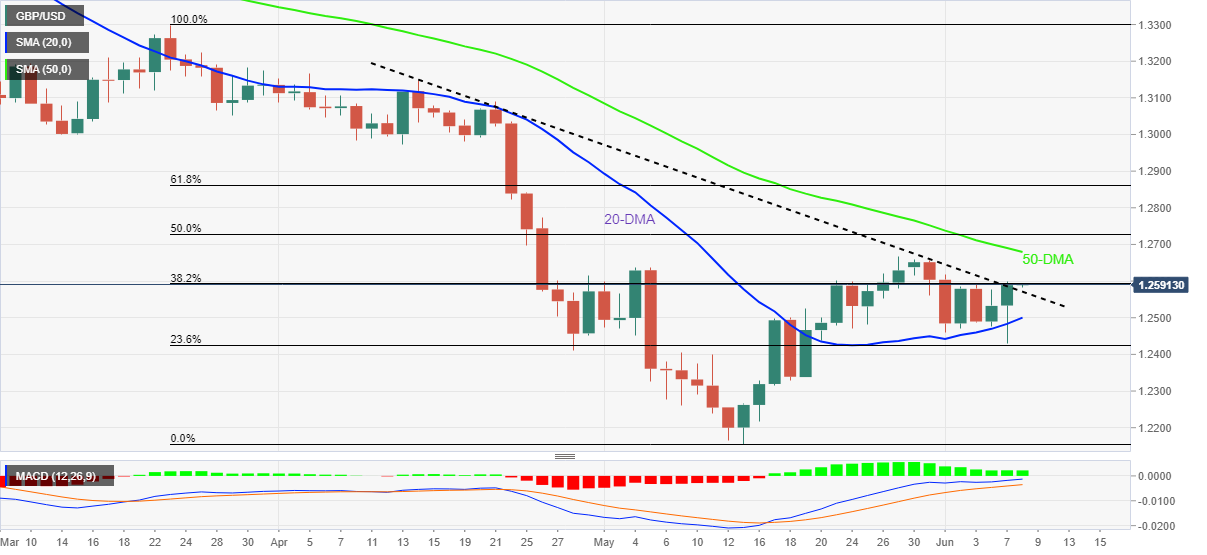
- Bullish MACD signals, break of two-month-old resistance favor buyers.
- May’s peak, 50-DMA test upside momentum, sellers await 20-DMA breakdown.
GBP/USD holds onto the short-term key resistance break as bulls attack 1.2600 during Wednesday’s Asian session.
In doing so, the cable pair also cheers the clear recovery from the 20-DMA amid bullish MACD signals.
However, last month's top and the 50-DMA, respectively around 1.2665 and 1.2680, challenge the GBP/USD pair buyers before giving them control.
Following that, a run-up towards 61.8% Fibonacci retracement (Fibo.) of March-May downside, near 1.2860, will gain the market’s attention.
Alternatively, pullback moves may initially aim for the previous resistance line from mid-May, around 1.2560, a break of which can direct GBP/USD sellers towards the 20-DMA support near 1.2500.
Should the cable pair closed beneath the 20-DMA support, the odds of witnessing a downside move towards the 1.2400 round figure can’t be ruled out.
GBP/USD: Daily chart
Trend: Further upside expected