GBP/USD Price Analysis: Bulls attempting to breakout for a higher daily high
- GBP/USD bulls seeking a higher high on the daily chart.
- The 4-hour time frame is offering some bullish structure.
GBP/USD has been in the hands of the bulls in the New York session and has broken a key level of resistance on the four-hour time frame. The following illustrates the progress that the bulls have been making at the start of the week below a key counter trendline.
GBP/USD H4 chart
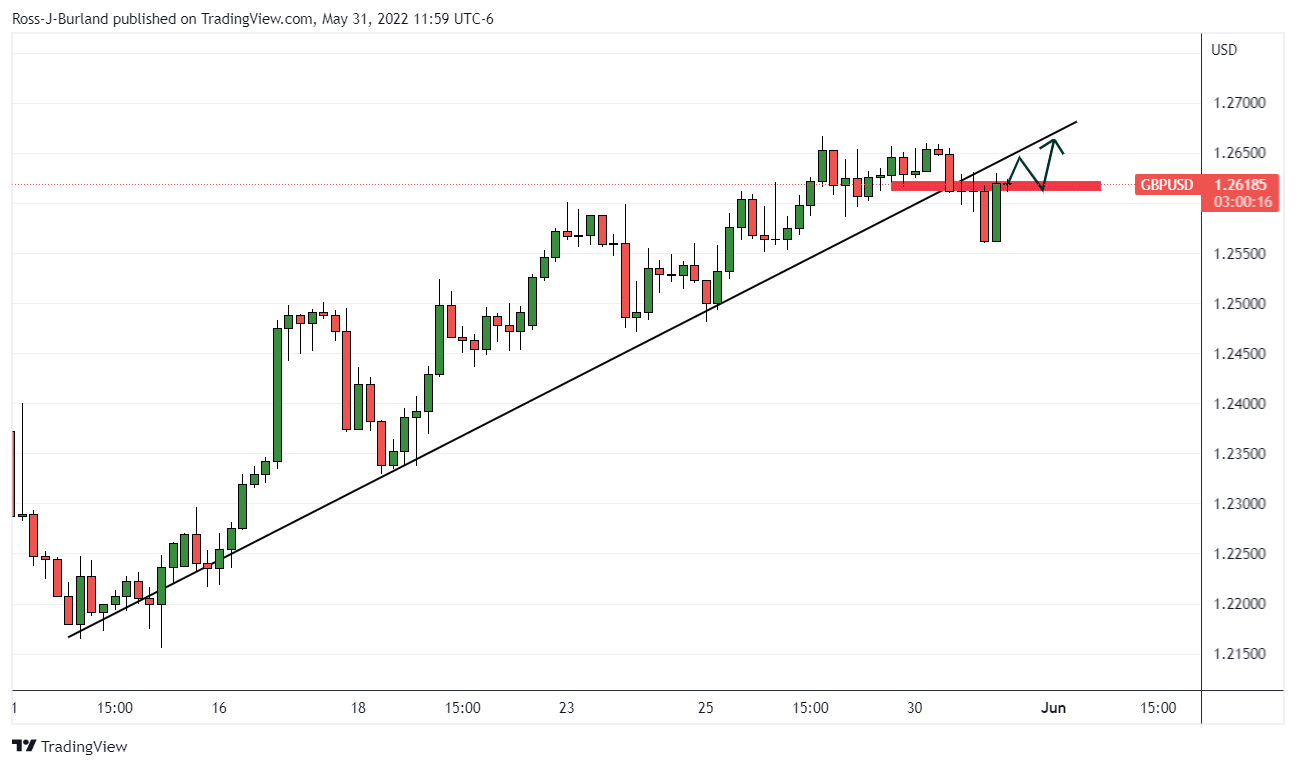
The price broke below counter-trendline support but the tweezer bottom is encouraging for the bulls. A break of resistance and subsequent retest of the counter trendline will leave prospects of an inverse head and shoulders, a bullish reversal pattern, usually most effective at the end of a trend, however. Nonetheless, potentially bullish for the days ahead.

GBP/USD daily chart

Meanwhile, the daily chart is promising given the support structures that have been formed on the breaks of resistance.
DXY H4 chart
From a US dollar perspective, the bearish W-formation is drawing in the price towards the neckline of the pattern.
If this were to give out as a failed support structure, then this will likely give way to further downside and aid the GBP bulls in their quest for higher highs.
