AUD/USD Price Analysis: Bulls coming up for their last breath?
- AUD/USD bulls need to close above 0.7560 or 0.7400 the figure will be exposed.
- Bears will look to the 38.2% Fibonacci retracement level as a target on repeated upside breakout failures.
AUD/USD has moved higher in New York trade as US equities rally. From a technical standpoint, the price is breaking into fresh cycle highs but until the October 2021 highs are well and truly cleared, the resistance could keep the bulls contained and the monthly W-formation should be noted.
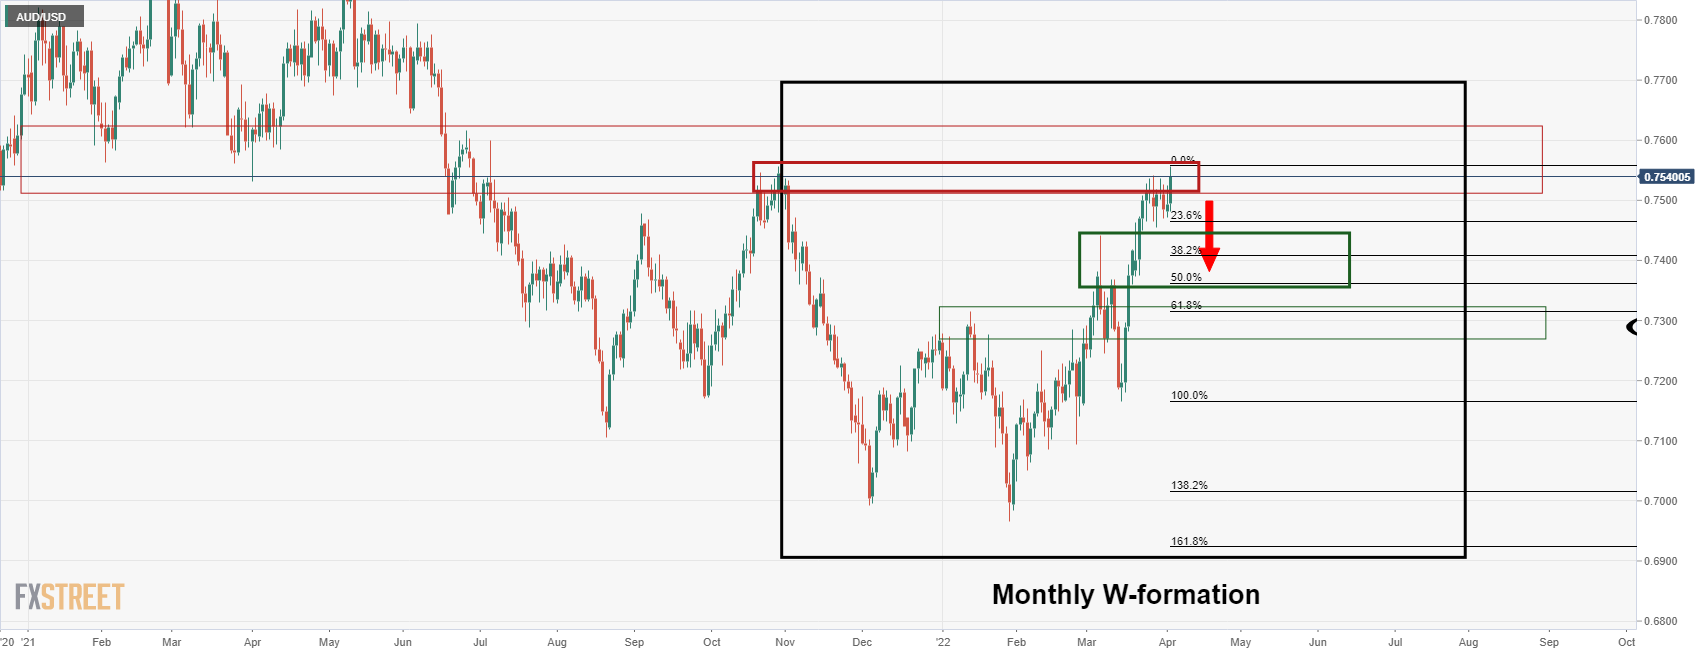
AUD/USD monthly chart
The W-formation is a reversion pattern and the price would be expected to revert to restest the neckline of the formation. In this case, the neckline is aligned with the 50% mean reversion level near 0.7260.
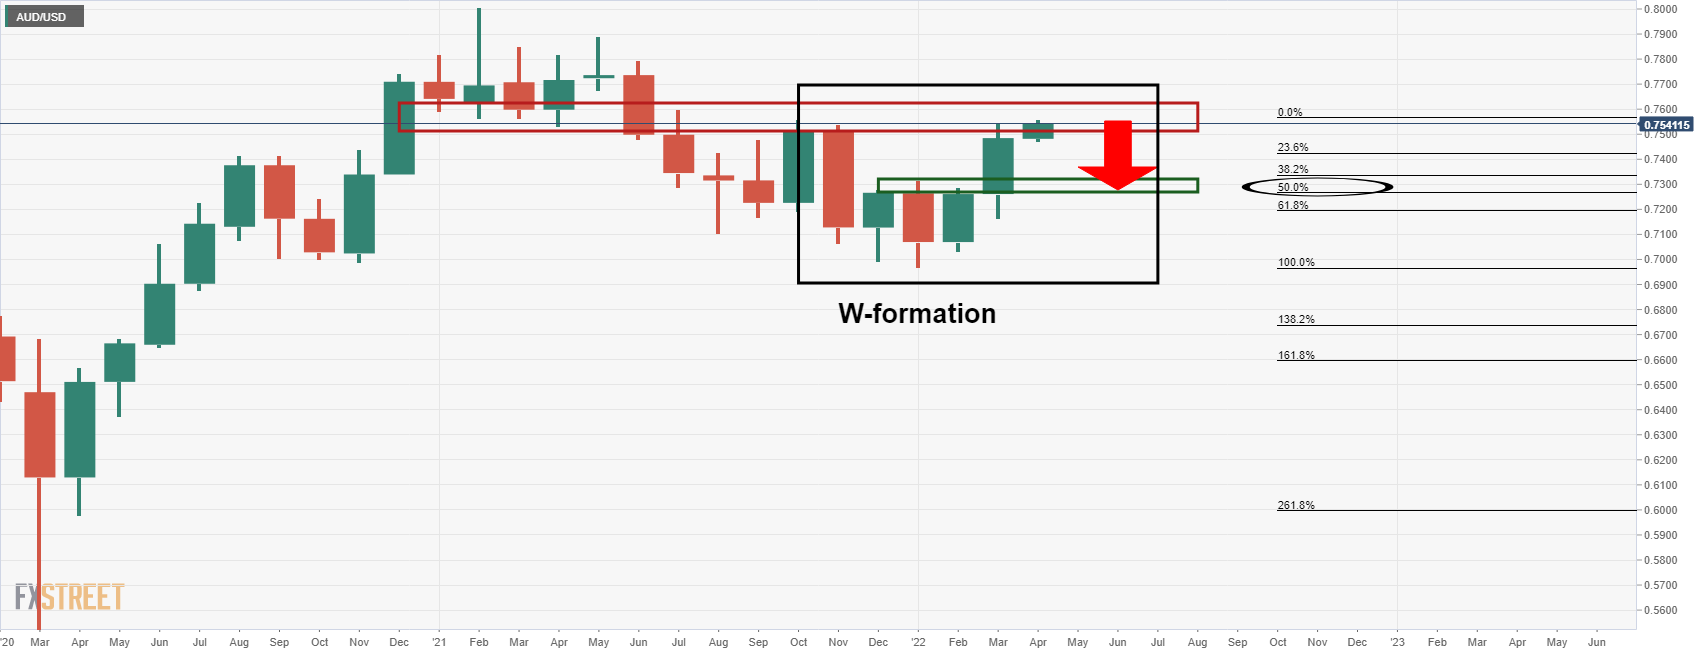
AUD/USD daily chart
Meanwhile, the daily chart shows that the price is running into a wall of daily resistance, so should the bulls be unable to break and close above 0.7560, then the focus will remain on the downside with 0.7400 the figure exposed as it comes near to the 38.2% Fibonacci retracement level.