AUD/JPY Price Analysis: An inverted hammer in the daily chart looms as the pair trimed 130-pips of gains
- The AUD/JPY finished the day with gains, though retreated from highs around 94.31.
- AUD/JPY Price Forecast: Upward biased, but the inverted hammer exposed the pair for further losses.
The AUD/JPY reached a new YTD high on Monday but retreated some, as profit-taking sent the pair tumbling and formed an “inverted hammer,” a candlestick with bearish implications, which has a long wick on the top of the real body, meaning that lower prices loom. At the time of writing, the AUD/JPY is trading at 93.00.
Risk appetite improved towards the end of the New York session as positive news from the Russia – Ukraine front emerged. Sources linked to the Financial Times reported that Russia is prepared to let Kyiv join the EU if it remains military non-aligned as part of ongoing ceasefire negotiations. The headlines lifted US equities, while in the FX space, nothing changed.
Overnight, the AUD/JPY edged higher since Monday’s Asian session. However, it peaked near the mid-European session at 94.31, plummeting afterward towards 92.19, just above the 50-hourly simple moving average(SMA), but later stabilized around 92.82.
AUD/JPY Price Forecast: Technical outlook
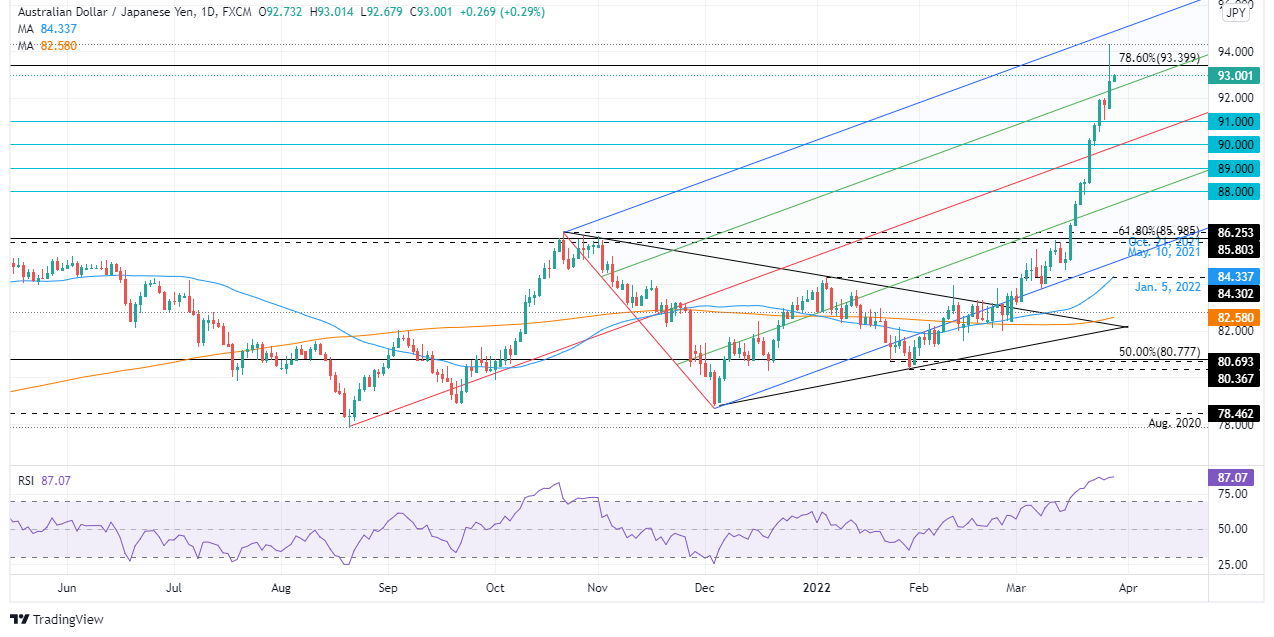
The AUD/JPY stills in an uptrend, but the inverted hammer leaves the pair vulnerable to selling pressure. Furthermore, the AUD/JPY briefly pierced the 78.6% Fibonacci retracement at 93.39, retreating towards Monday’s daily low at 92.19, and then reclaimed the mid-line between Pitchfork’s top-central parallel lines around 92.90.
Downwards, the AUD/JPY first support would be 92.00. Once cleared, the next demand zone would be the 91.00 mark, followed by Pitchfork’s central parallel line around 90.00.
Upwards, the AUD/JPY’s first resistance would be the psychological 93.00 mark. Breach of the latter would expose the 78.6% Fibonacci level again at 93.39, followed by the 94.00 mark and the YTD high at 94.31.
Technical levels to watch