28 Mar 2022
GBP/USD Price Analysis: Bears are on the prowl, seeking a break of 1.3120
- GBP/USD bulls are attempting to correct the weekly sell-off.
- Daily support at 1.3120 should be an important level for the week ahead.
GBP/USD's M-formation on the weekly chart is a reversion pattern whereby there are prospects of a correction towards the neckline as illustrated in the following chart:
GBP/USD weekly chart
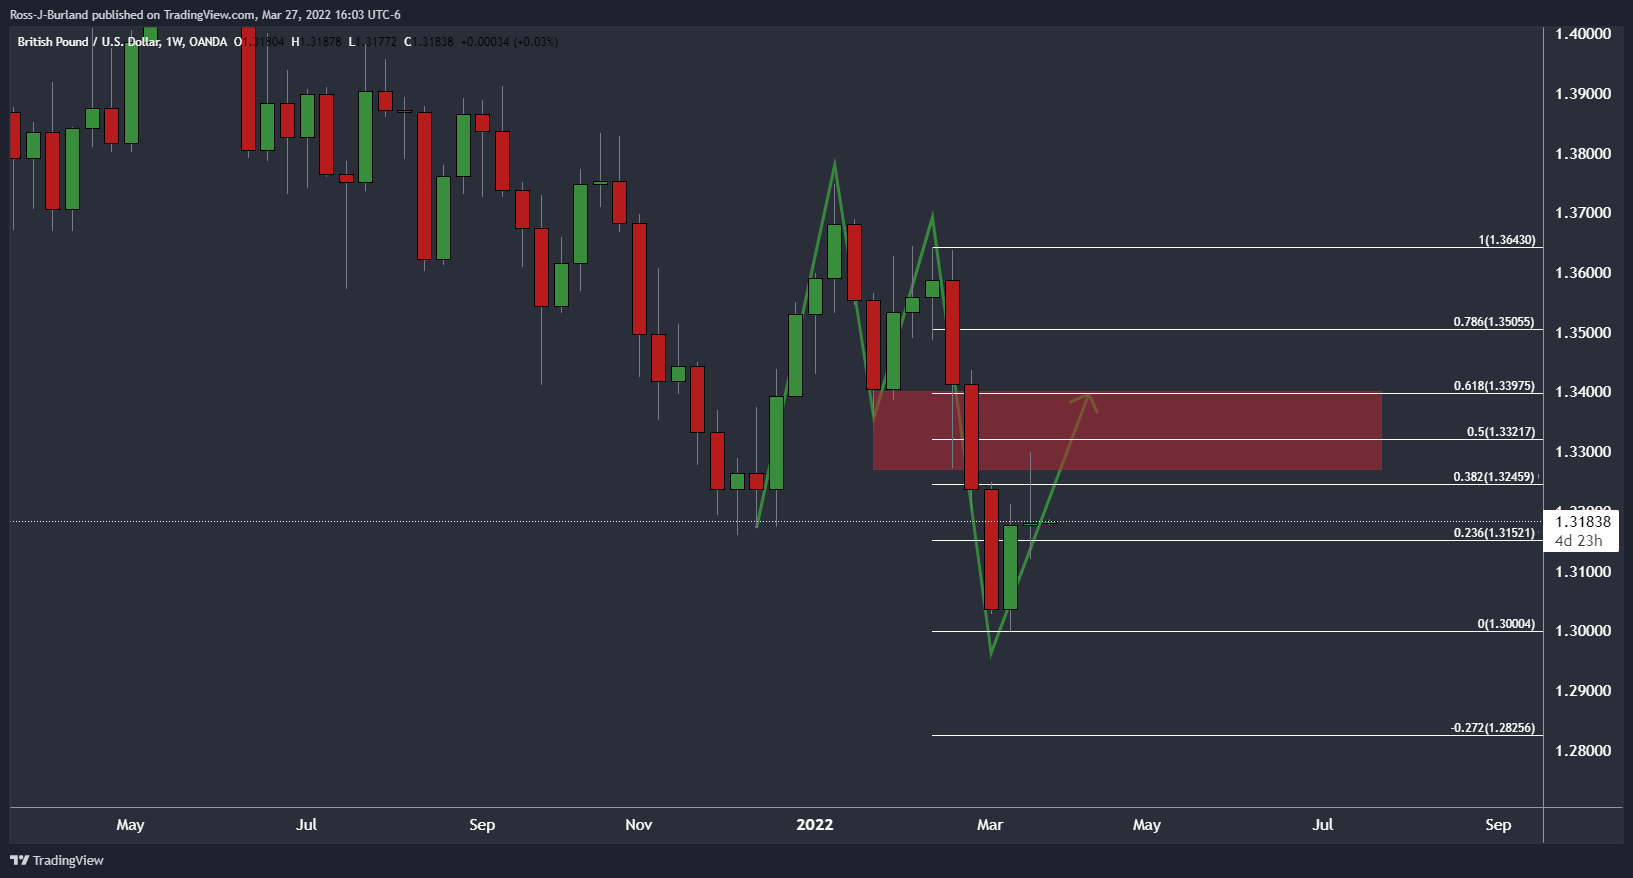
The price of sterling has been in free-fall over the past few weeks in a bearish weekly impulse which is now being corrected. The bulls are moving on the 38.2% Fibonacci retracement level which had already been tested in the middle of last week's business.
GBP/USD daily chart
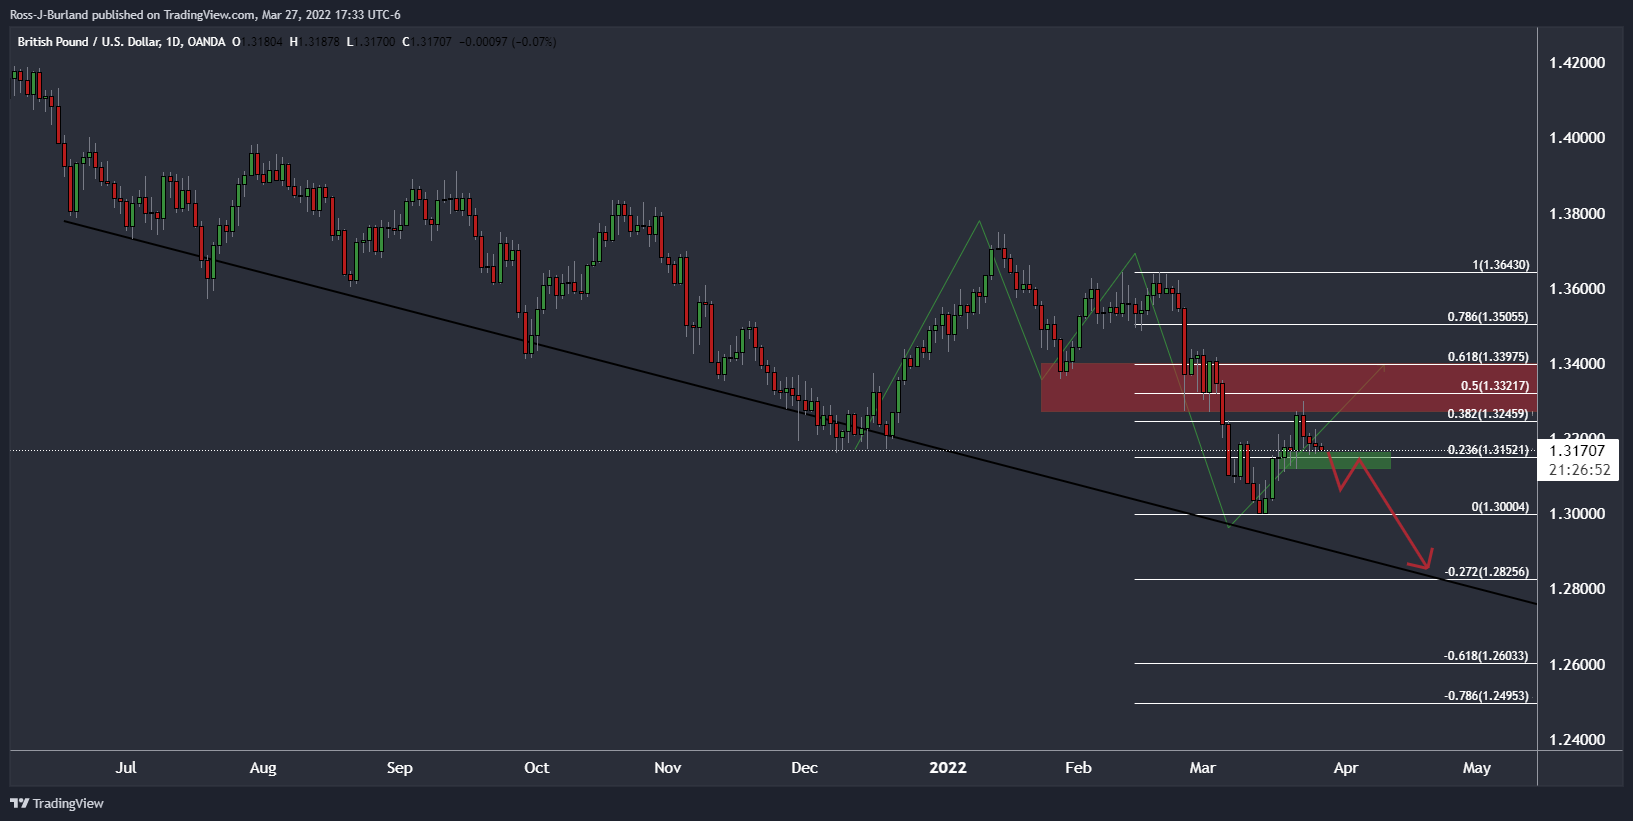
If 1.3120 holds as daily support, then there will be prospects further to go in the correction for the week ahead. Should it not, then the bears could be encouraged to get on board for what might be the makings for a downside extension for the weeks ahead.