AUD/USD Price Analysis: Bears approach 0.7200 by snapping three-day winning streak
- AUD/USD remains on the back foot around intraday bottom, marking the first negative day in four.
- Bearish MACD signals on 4H join failures to cross 100-DMA and descending trend line from November to favor sellers.
- 200-DMA adds to the upside filters, rising wedge confirmation will propel bearish impulsive.
AUD/USD stands on the slippery ground near 0.7205 as it snaps the previous three-day uptrend, down 0.35% intraday, during Thursday’s Asian session.
In doing so, the Aussie pair justifies the previous day’s failure to provide a daily closing beyond the 100-DMA and a 14-week-old descending trend line.
AUD/USD: Daily chart
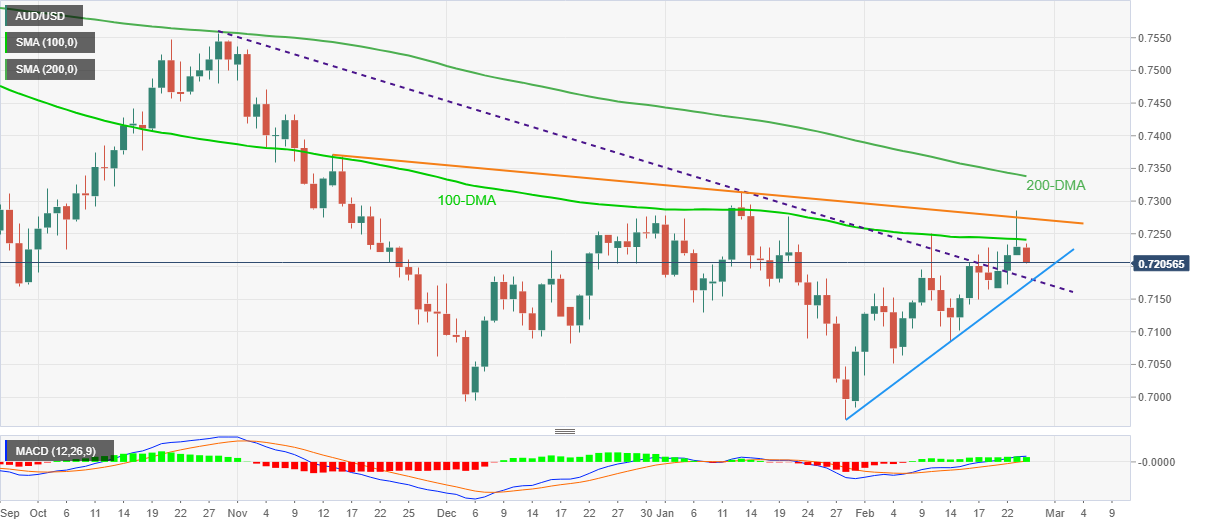
However, the previous resistance line from late October, close to 0.7180 may restrict the quote’s immediate declines. Also acting as a downside filter is an upward sloping trend line from January 28, near 0.7170 by the press time.
It’s worth noting that a clear break of 0.7170 will need validation from 200-SMA on the four-hour (4H) chart to back the rising wedge bearish chart pattern, which in turn will direct AUD/USD sellers towards the early 2022 bottom surrounding 0.6965.
AUD/USD: Four-hour chart

Alternatively, the 100-DMA and a two-week-long resistance line, respectively around 0.7240 and 0.7275, guard the pair’s immediate upside.
Following that, the upper line of the stated wedge formation and the 200-DMA on a daily chart, close to 0.7300 and 0.7340 in that order, will be crucial to watch for AUD/USD bulls.