Gold Price Forecast: XAU/USD key levels to watch heading into 2022 – Confluence Detector
- Gold price remains depressed in a familiar range around the $1,800 mark.
- 10-year US Treasury yields are back above 1.50%, pressurizing gold price.
- Gold 2022 Outlook: Correlation with US T-bond yields to drive yellow metal.
Amid thin-year end liquidity conditions, gold price continues to trade choppy within familiar levels, largely pivoting around the $1,800 mark. The downbeat sentiment around gold price could be attributed to a broad-based US dollar rebound, aided by the recent strength in the Treasury yields. The 10-year rates have recaptured the 1.50% key level, which warrants caution for gold bulls. Going forward the year-end repositioning in the greenback will continue to have a significant impact on gold while thin conditions could exaggerate the moves.
Read: Gold Price Forecast: Year-end flows to keep XAU/USD choppy around $1,800
Gold Price: Key levels to watch
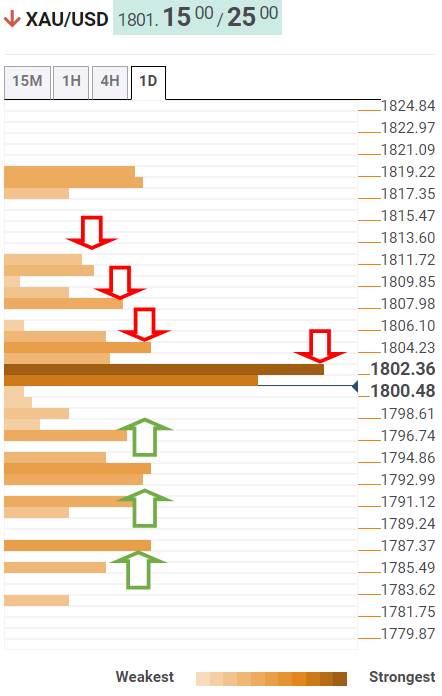
The Technical Confluences Detector shows that the gold price is struggling to recapture strong resistance at $1,803, which is the intersection of the Fibonacci 38.2% one-week, Fibonacci 61.8% one-day and SMA10 one-day.
The immediate upside will then be capped by the Fibonacci 38.2% one-month of $1,806. The previous day’s high of $1,808 will provide another roadblock to gold buyers.
Acceptance above the latter could fuel a renewed uptick towards the previous week’s high of $1,811, above which the December top of $1,820 will be on the bulls’ radars.
On the flip side, the Fibonacci 38.2% one-day at $1,796 will get tested on a sustained move below $1,800.
A dense cluster of healthy support levels is aligned around $1,793, which will be a powerful cap. That price zone comprises of the SMA100 four-hour, Fibonacci 23.6% one-day and pivot point one-week S1.
SMA100 one-day at $1,791 will be the next downside target, below which sellers will aim for the Fibonacci 23.6% one-month at $1,787.
Here is how it looks on the tool
About Technical Confluences Detector
The TCD (Technical Confluences Detector) is a tool to locate and point out those price levels where there is a congestion of indicators, moving averages, Fibonacci levels, Pivot Points, etc. If you are a short-term trader, you will find entry points for counter-trend strategies and hunt a few points at a time. If you are a medium-to-long-term trader, this tool will allow you to know in advance the price levels where a medium-to-long-term trend may stop and rest, where to unwind positions, or where to increase your position size.