Gold Price Forecast: XAU/USD cheers flight to safety, key levels to watch – Confluence Detector
- Gold price underpinned by the risk-off mood as US’ Manchin rejects BBB.
- Treasury yields keep falling, caps the US dollar’s upside despite risk-aversion.
- Gold price set to retest key $1,815 supply zone amid risk-aversion.
Gold price is off the three-week highs but remains buoyed by the risk-off market profile. Uncertainties surrounding the Omicron covid variant sap investors’ confidence. Meanwhile, US Senator Joe Manchin left Democrats hanging with Biden Bill rejection, jeopardizing the $1.75 fiscal sending plan. Falling Treasury yields continue to undermine the US dollar, offering additional support to gold. Amid a light calendar, the broader market sentiment will continue to play a pivotal role in gold’s price action.
Read: Gold 2022 Outlook: Correlation with US T-bond yields to drive yellow metal
Gold Price: Key levels to watch
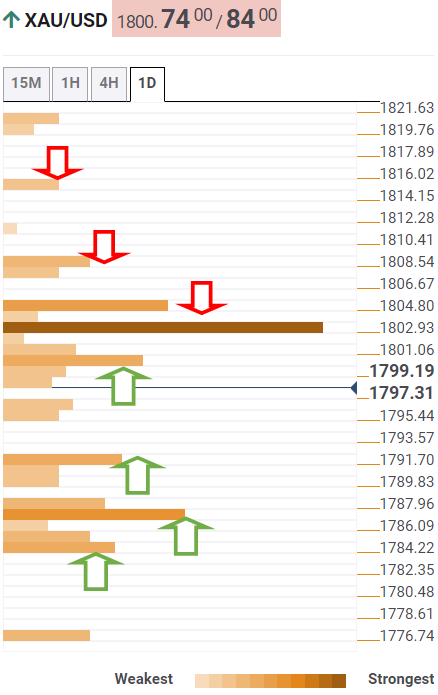
The Technical Confluences Detector shows that the gold price seems to have found some support at $1,797, the convergence of the SMA50 one-day, SMA5 four-hour and Fibonacci 23.6% one-week.
A failure to resist above the latter will trigger a drop towards $1,791, where the Fibonacci 38.2% one-week coincides with the SMA100 one-day.
Further south, strong support awaits at $1,787, the intersection of the SMA5 one-day and Fibonacci 23.6% one-month.
The last line of defense for gold buyers is seen at $1,783. At that point, the SMA10 one-day meets with the pivot point one-day S2.
Alternatively, fresh buying opportunities will arise only on a sustained break above $1,803-$1,804 supply zone, which is the confluence of the Fibonacci 38.2% one-month, Fibonacci 38.2% one-day and previous high four-hour.
The Fibonacci 61.8 one-day at $1,807 will offer powerful resistance on the upside. The previous day’s high of $1,814 will be next on the buyers’ radars.
Here is how it looks on the tool
About Technical Confluences Detector
The TCD (Technical Confluences Detector) is a tool to locate and point out those price levels where there is a congestion of indicators, moving averages, Fibonacci levels, Pivot Points, etc. If you are a short-term trader, you will find entry points for counter-trend strategies and hunt a few points at a time. If you are a medium-to-long-term trader, this tool will allow you to know in advance the price levels where a medium-to-long-term trend may stop and rest, where to unwind positions, or where to increase your position size.