Gold Price Forecast: XAU/USD remains vulnerable ahead of Fed, levels to watch – Confluence Detector
- Gold price sticks to two-week lows ahead of the Fed rate decision.
- Fed’s pace of tapering and Dot plot graph to rock the markets.
- Gold at the mercy of the Fed, ascending triangle pattern in play.
The hawkish Fed expectations are undermining gold price heading into the policy announcements this Wednesday. Gold price is hovering near its two-week lows, with its fate hinging on the Fed’s pace of tapering, which will likely hint at potential rate hikes next year. Investors have turned cautious and refrain from placing any directional bets on the bright metal.
Read: Gold Price Forecast: Will XAU/USD defend critical $1,765 support on the Fed decision?
Gold Price: Key levels to watch
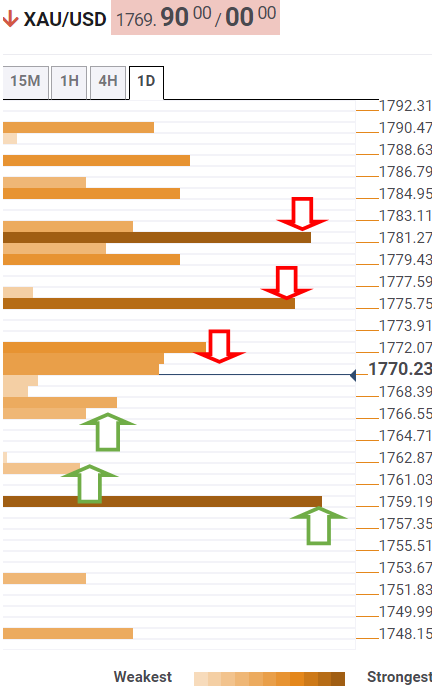
The Technical Confluences Detector shows that the gold price tested the key support near $1,765 amid the latest leg down. That level is the convergence of the previous day’s low and the previous low four-hour.
Gold bears now target the pivot point one-day S1 at $1,762 on selling resurgence. Powerful support at $1,760 will then challenge the bullish commitments. At that point, the previous month’s low coincides with the pivot point one-week S2.
Alternatively, the recovery is likely to face stiff resistance around the $1,770-$1,772 region, where Fibonacci 23.6% one-day, SMA5 four-hour and pivot point one-week S1 converge.
Further up, the intersection of the Fibonacci 38.2% one-day and Fibonacci 23.6% one-week at $1,776 will come into play.
The next bullish target is envisioned at $1,781, the confluence of the SMA5 one-day, Fibonacci 61.8% one-day and Fibonacci 38.2% one-week.
Here is how it looks on the tool
About Technical Confluences Detector
The TCD (Technical Confluences Detector) is a tool to locate and point out those price levels where there is a congestion of indicators, moving averages, Fibonacci levels, Pivot Points, etc. If you are a short-term trader, you will find entry points for counter-trend strategies and hunt a few points at a time. If you are a medium-to-long-term trader, this tool will allow you to know in advance the price levels where a medium-to-long-term trend may stop and rest, where to unwind positions, or where to increase your position size.