AUD/USD Price Analysis: Stays depressed inside falling wedge as bears eye 0.7170
- AUD/USD flirts with seven-week low inside bullish chart formation.
- Bearish MACD signals contrast nearly oversold RSI conditions to challenge bears around short-term support line.
- 50-DMA, 100-DMA offer tough nut to crack for the bulls.
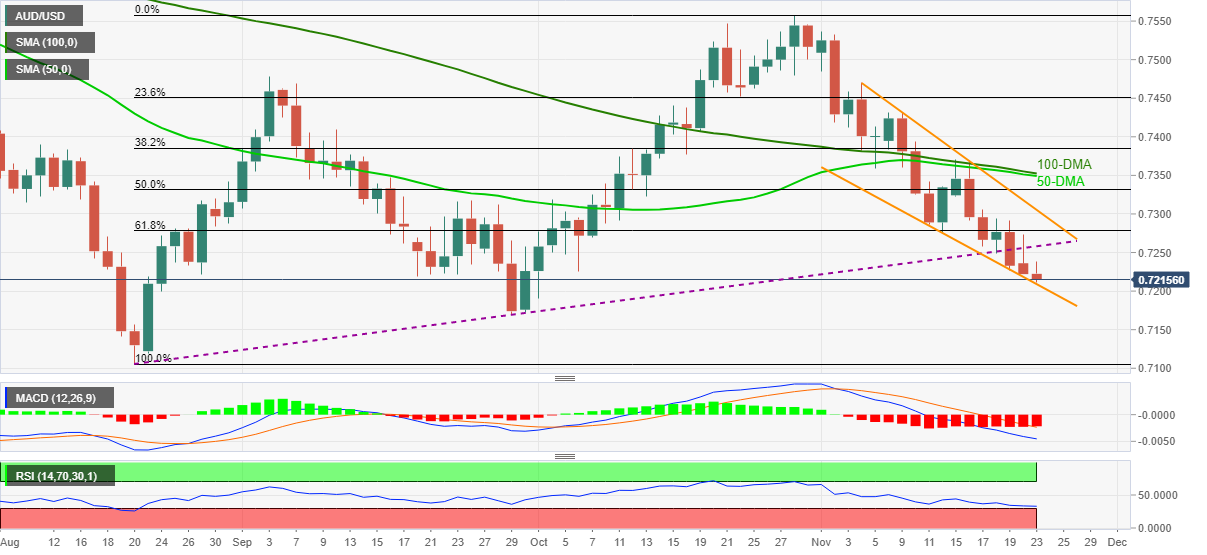
AUD/USD bounces off intraday low, also the lowest since October 01, heading into Tuesday’s European session. Even so, the Aussie pair prints a three-day downtrend around 0.7220 by the press time.
The quote’s latest rebound could be linked to the nearly oversold RSI conditions and a lower line of the 13-day-old falling wedge chart pattern.
It should be noted, however, that the quote’s sustained trading below an ascending support line from August, now resistance around 0.7265, keeps the AUD/USD bears hopeful of breaking the nearby support of 0.7205.
Following that, September’s low of 0.7169 may entertain the sellers before the likely corrective pullback considering the RSI conditions. Should the quote refrain from bouncing off 0.7169, the yearly low marked in August around 0.7105 will be in focus.
Meanwhile, 61.8% Fibonacci retracement level of August-October upside around 0.7280 precedes the stated wedge’s resistance line, near 0.7305, to restrict short-term advances of the AUD/USD prices.
In a case where the Aussie pair confirms the bullish chart pattern by crossing the 0.7305 hurdle, a convergence of the 100-DMA and the 50-DMA surrounding 0.7350-55 will be crucial to watch.
AUD/USD: Daily chart
Trend: Further downside expected