AUD/USD Price Analysis: Bears to target 0.7220, bulls look for test of 0.7420
- AUD/USD bears need to watch out for the trap.
- Bullish reversal pattern spotted on the daily chart.
- Bears await the break of weekly trendline support to target 0.7220.
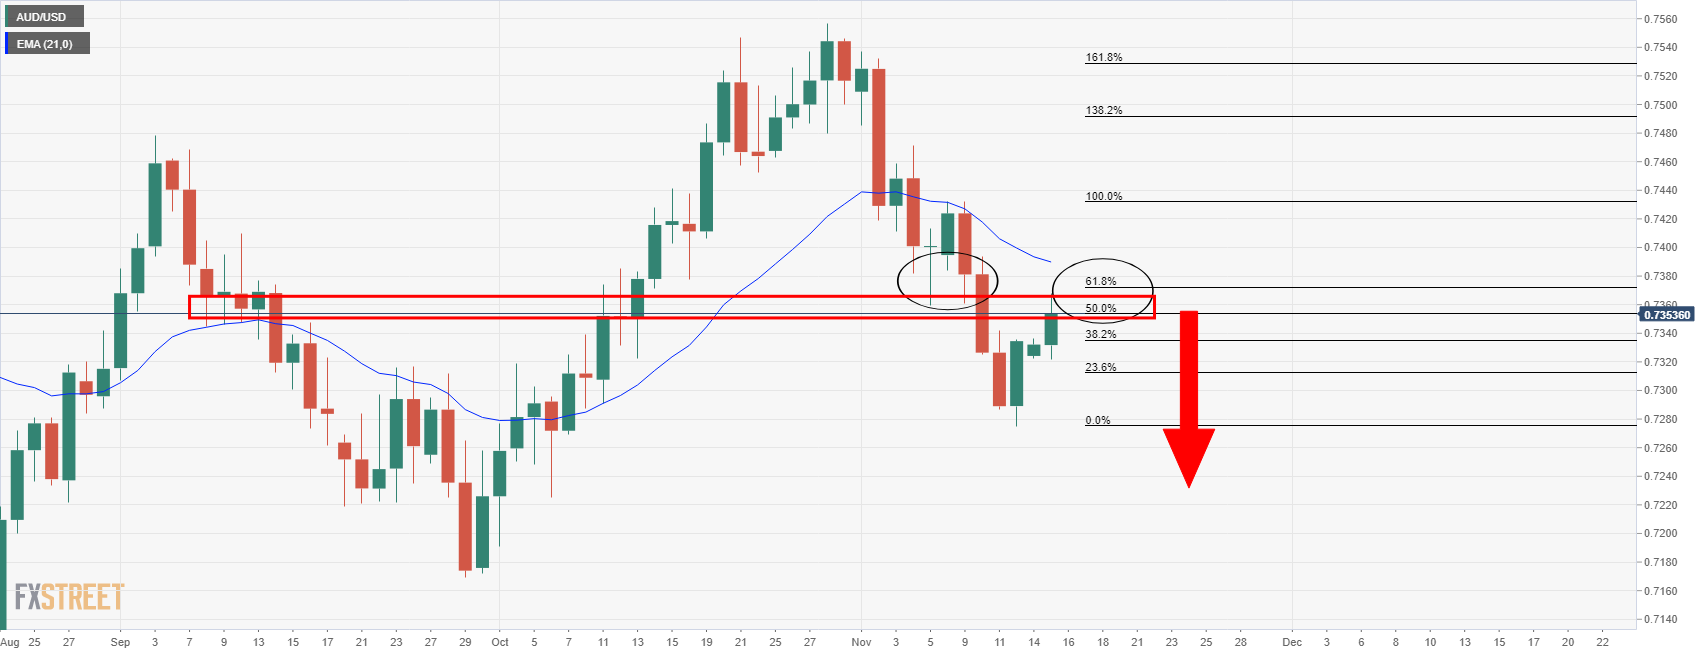
AUD/USD is in the process of an upside correction according to the daily chart and has broken the 38.2% Fibonacci retracement level for the opening day. This was located at 0.7336 and a pip higher than the highs of Friday.
The price has since climbed through the 50% mean reversion and has come close to a test of the golden 61.8% Fibo at 0.7323. This is an area of heavier resistance given the confluence of bearish moving averages. At this juncture, the bears could start looking for an optimal entry in anticipation of a downside continuation.
AUD/USD daily chart
AUD/USD weekly chart
However...
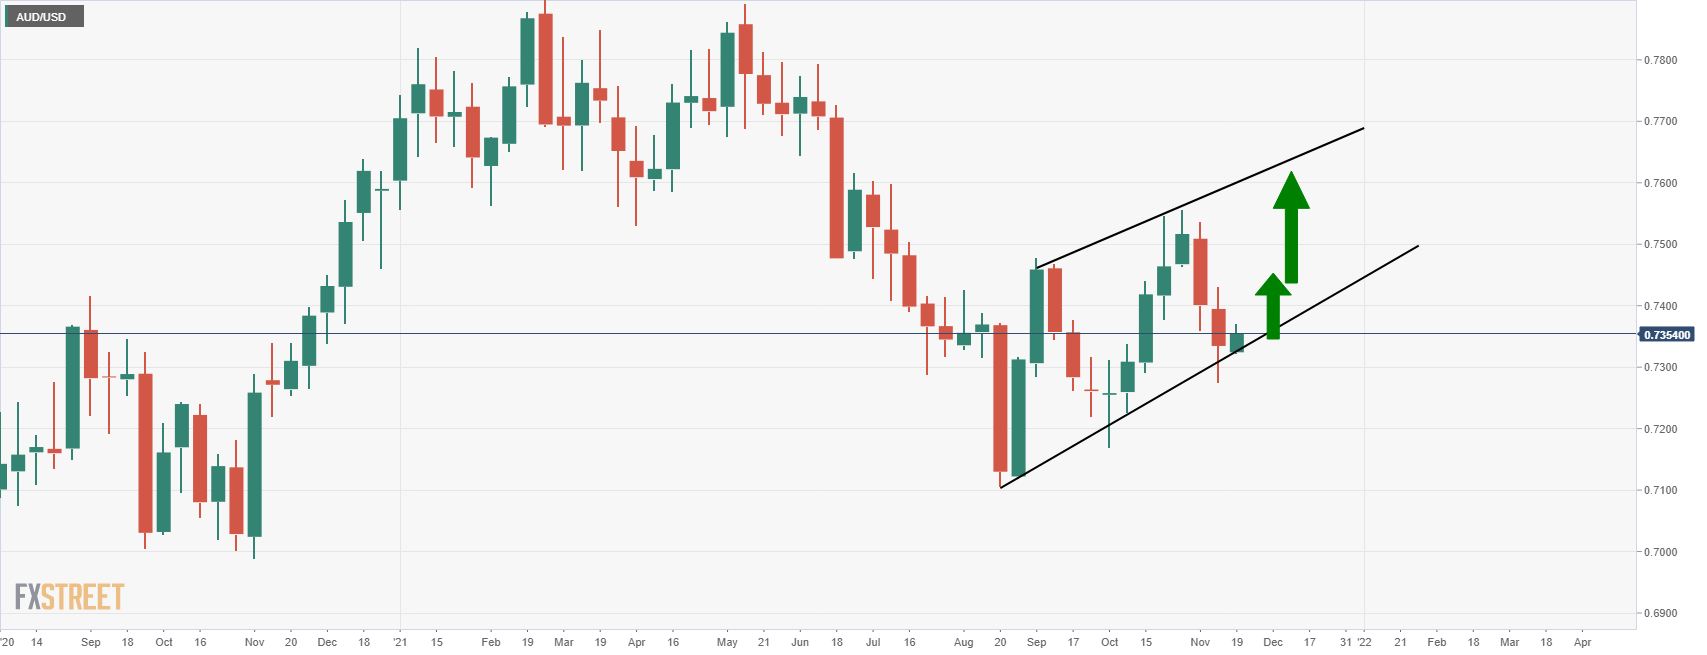
... the weekly time frame is not so bearish while there are prospects of the dynamic support holding and resulting in a higher high for the weeks ahead. In examining the daily chart a little closer as well, the 12 Nov bar was bullish engulfing:
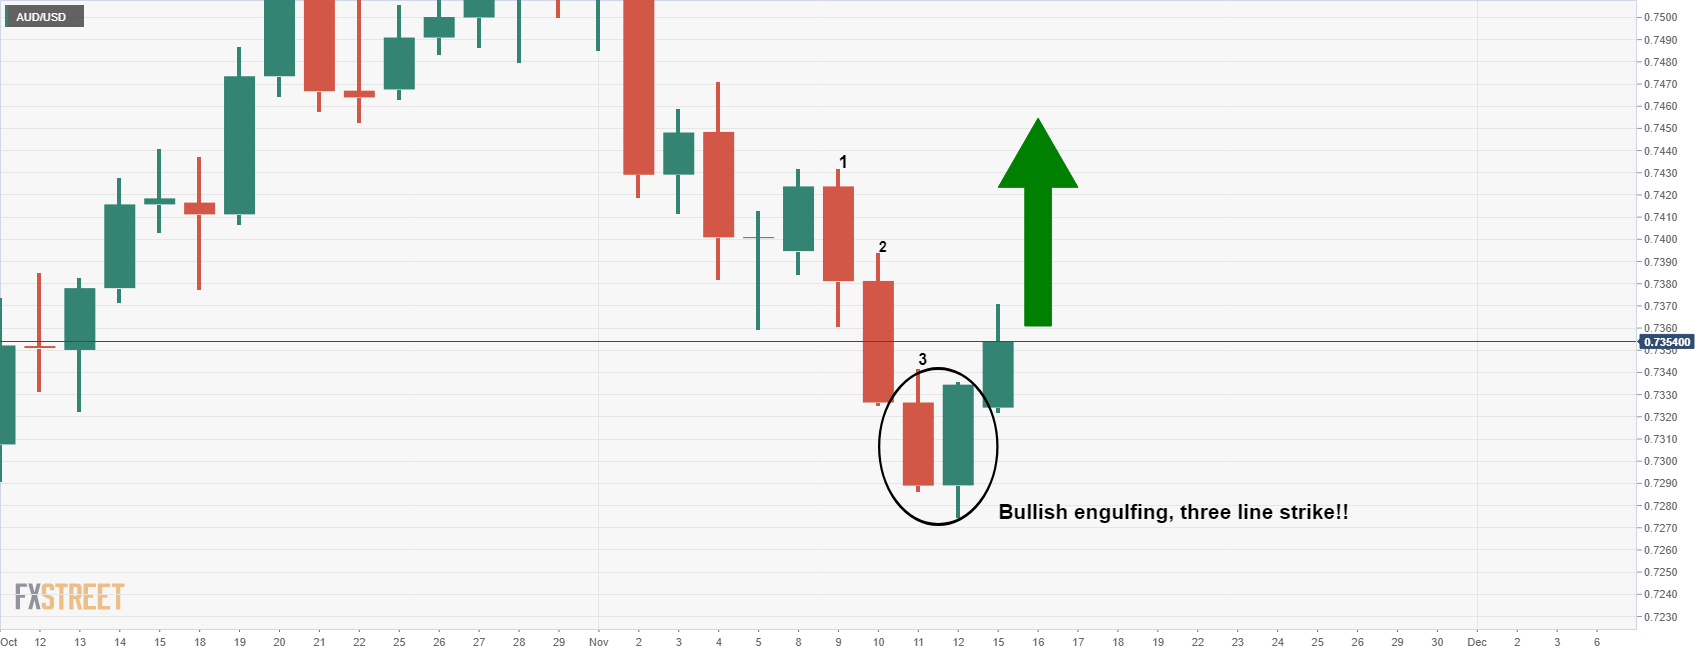
This is actually a three-line strike candlestick formation which is a reversal pattern. Therefore, we could see the weekly outlook playout should the price clear the overhead resistance and breakout above 0.7420:
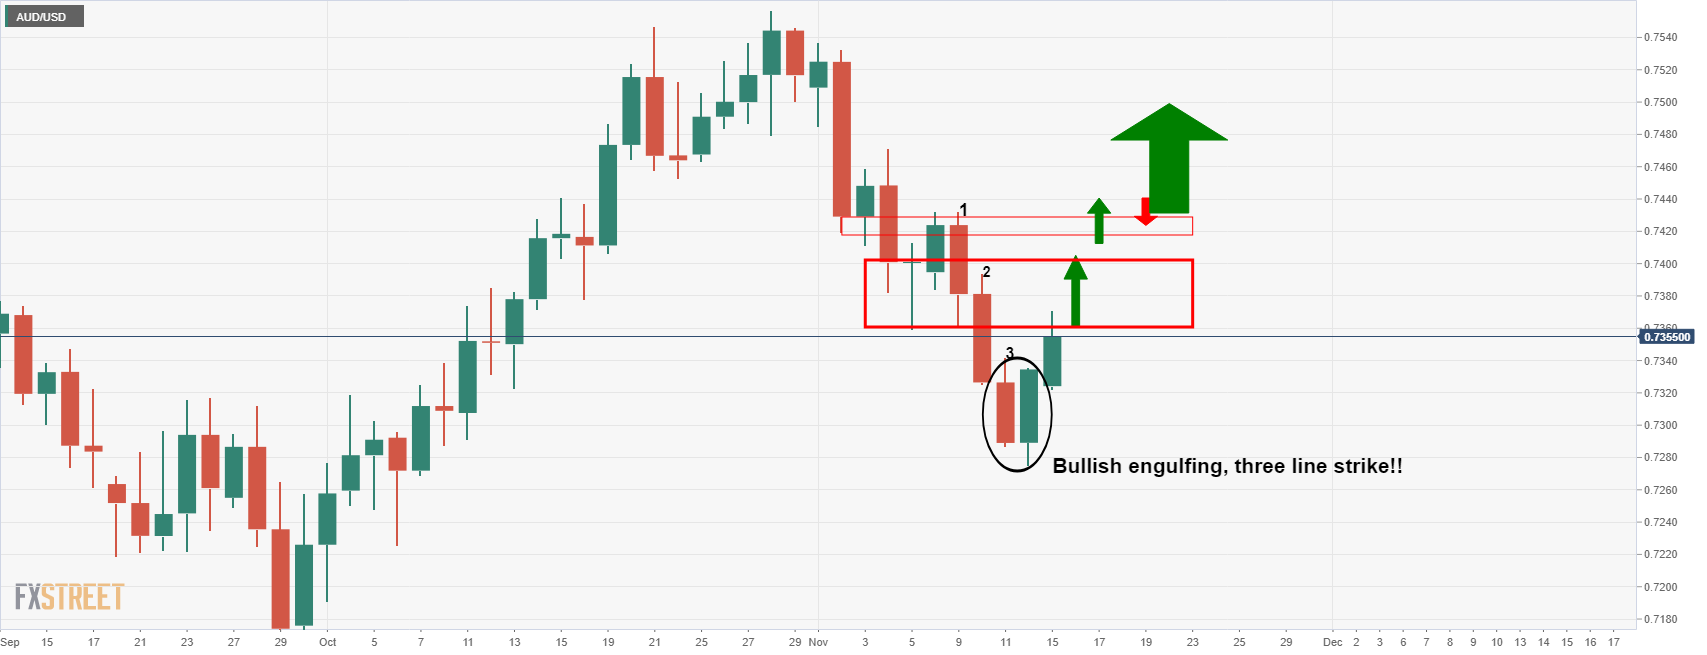
On the other hand, should the weekly dynamic trendline support break and price drop below 0.7320, then the three-line strike will be invalidated as a trade set-up and the bears will be back in control.
Bears can still get prepared for a downside continuation by monitoring for a bearish environment from the 4-hour car as follows:
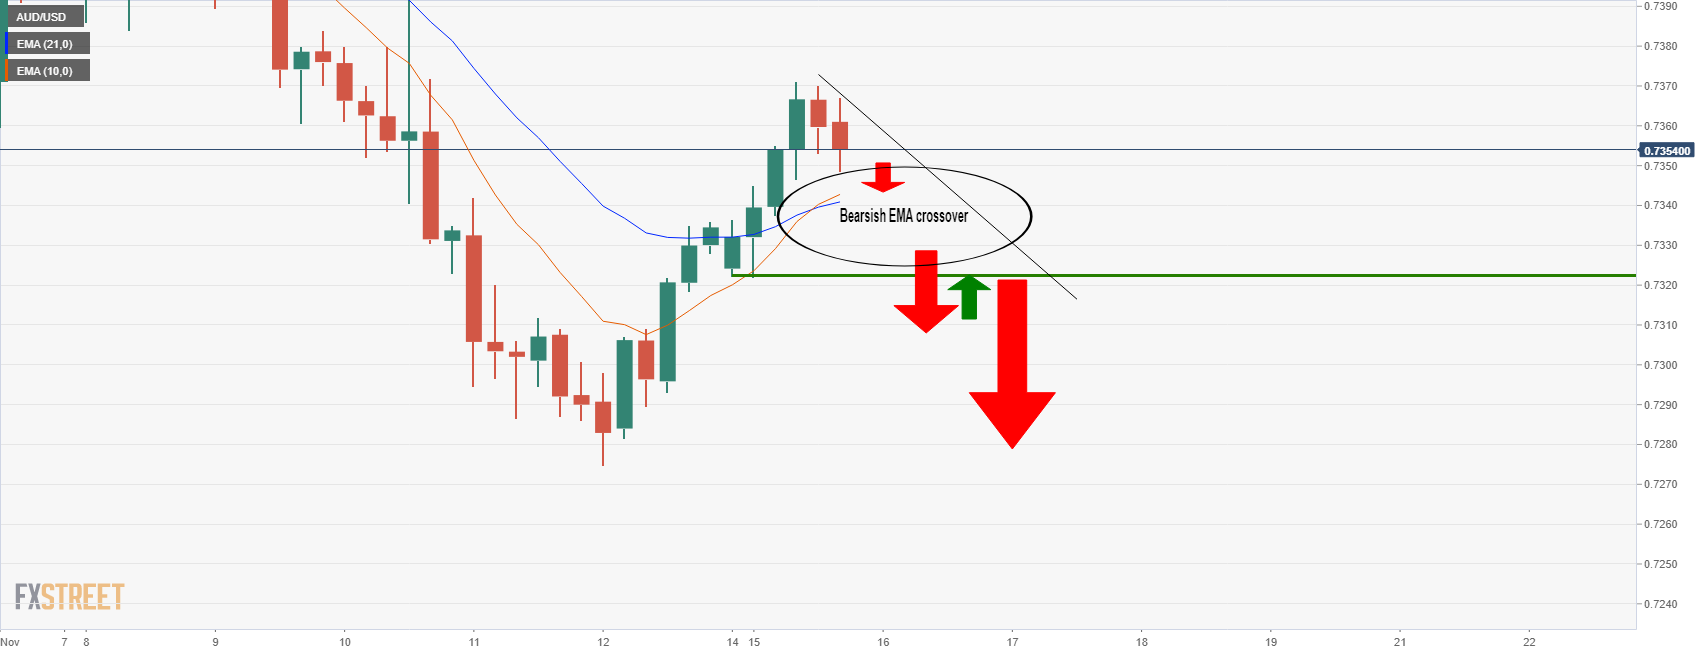
The bears will be looking for the 21 and 10 EMAs to turn south and crossover o signal a bearish environment. A break of the 0.7320s will likely result in a downside continuation for a fresh daily low towards 0.7250 and then 0.7220.