WTI Price Analysis: Challenges key trendline hurdle just above $81 mark
- WTI renews seven-year highs amid persisting global energy crunch.
- The US oil is set to test the rising trendline hurdle at $81.10 on the 4H chart.
- Overbought RSI, light trading could exaggerate the moves in WTI.
WTI (NYMEX futures) bulls remain unstoppable, as they look to test the offers above the $81 mark, as major world economies grapple with an ongoing energy supply crunch.
With the covid situation improving globally and most economies emerging successfully out of the pandemic-induced lockdowns, the demand for black gold is on the rise, supporting the price rally.
In another evidence of increasing confidence in oil, fund managers increased their net long positions in the US crude futures and options in the week to October 5, according to the latest Commodity Futures Trading Commission (CFTC) data.
From a short-term technical perspective, WTI is inching closer towards the rising trendline resistance at $81.10 on the four-hour chart, beyond which there are increasing odds of the bulls initiating a fresh uptrend towards $82.
WTI: Four-hour chart
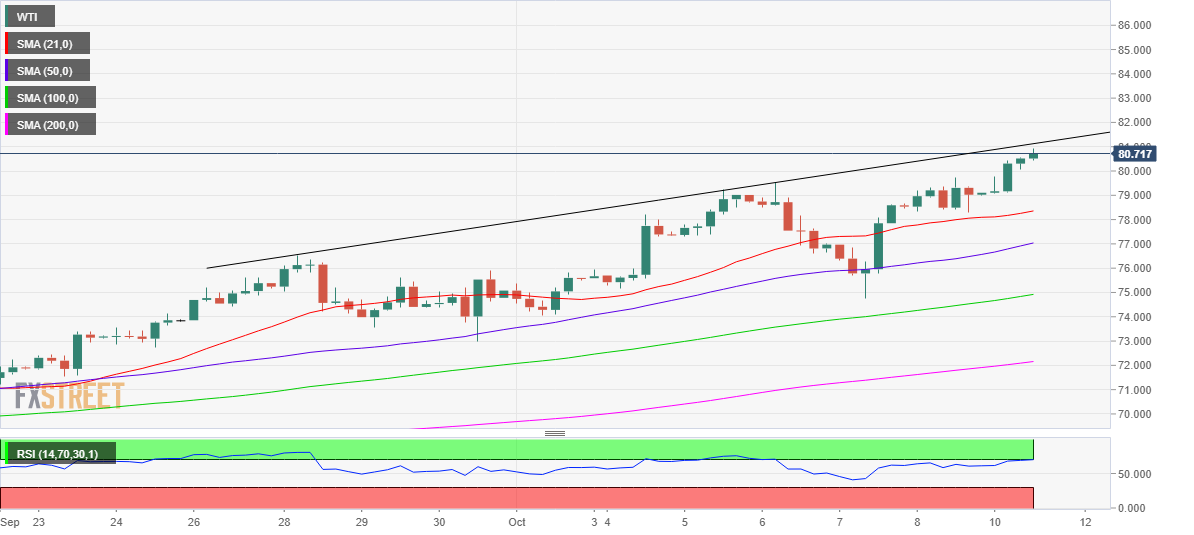
However, with the Relative Strength Index (RSI) peeping into the overbought region, currently at 70.48, the bulls could turn cautious.
Therefore, a retreat towards the $80 psychological level cannot be ruled out before the next upswing kicks in.
The 21-Simple Moving Average (SMA) at $78.36 will offer critical support to the oil buyers.
WTI: Additional levels to watch