AUD/USD Price Analysis: 0.7315-20 hurdle continues to cap the upside, at least for now
- A modest USD weakness assisted AUD/USD to gain some positive traction on Thursday.
- Mixed technical indicators on hourly/daily charts warrant caution for aggressive traders.
- A sustained move beyond the 0.7315-20 region is needed to confirm a bullish breakout.
The AUD/USD pair maintained its bid tone heading into the North American session and shot to one-and-half-week tops, around the 0.7310 region in the last hour.
The risk-on impulse in the markets undermined demand for the safe-haven US dollar, which, in turn, was seen as a key factor that benefitted the perceived riskier aussie. However, prospects for an early policy tightening by the Fed and better-than-expected US Weekly Jobless Claims helped limit the USD losses, capping gains for the AUD/USD pair.
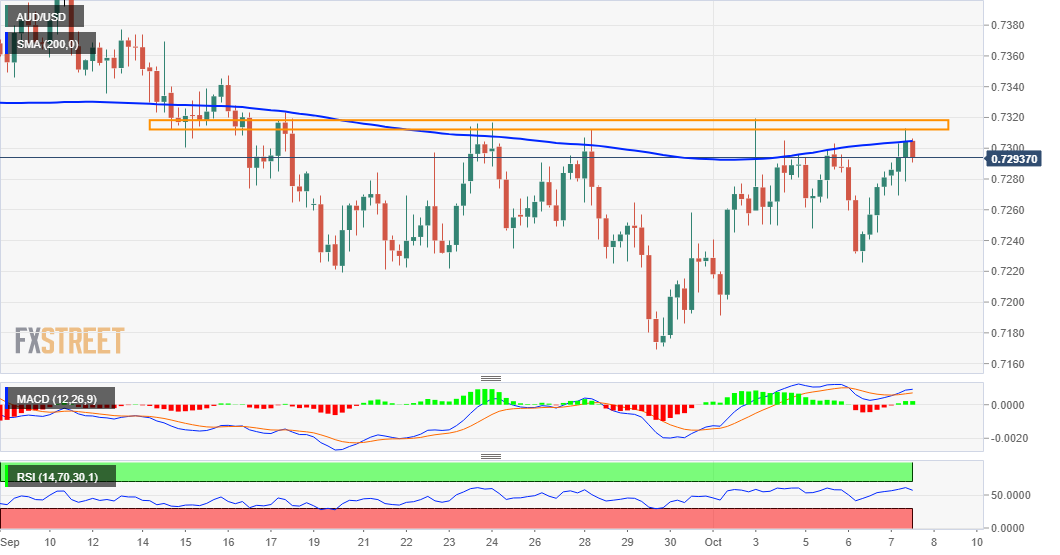
From a technical perspective, bulls need to wait for a sustained move beyond the 0.7315-20 supply zone before positioning for any further gains. The AUD/USD pair might then surpass the 0.7365 intermediate hurdle and reclaim the 0.7400 mark. The momentum could get extended towards mid-0.7400s en-route September swing highs, near the 0.7475-80 area.
Meanwhile, technical indicators on hourly charts have been gaining positive traction and are still far from being in the overbought zone. However, oscillators on the daily chart – though have recovered from the negative territory – are yet to confirm a bullish bias. This further warrants some caution for aggressive bullish traders.
On the flip side, the 0.7225-20 horizontal zone now seems to have emerged as immediate strong support for the AUD/USD pair ahead of the 0.7200 mark. A convincing break below will shift the bias in favour of bearish traders and set the stage for a fall towards challenging YTD lows, around the 0.7100 round-figure mark touched on August 20.
AUD/USD 4-hour chart
Technical levels to watch