US Dollar Index Price Analysis: DXY pullback to 93.00 on the cards
- DXY bulls take a breather after three-week uptrend, step back from monthly high.
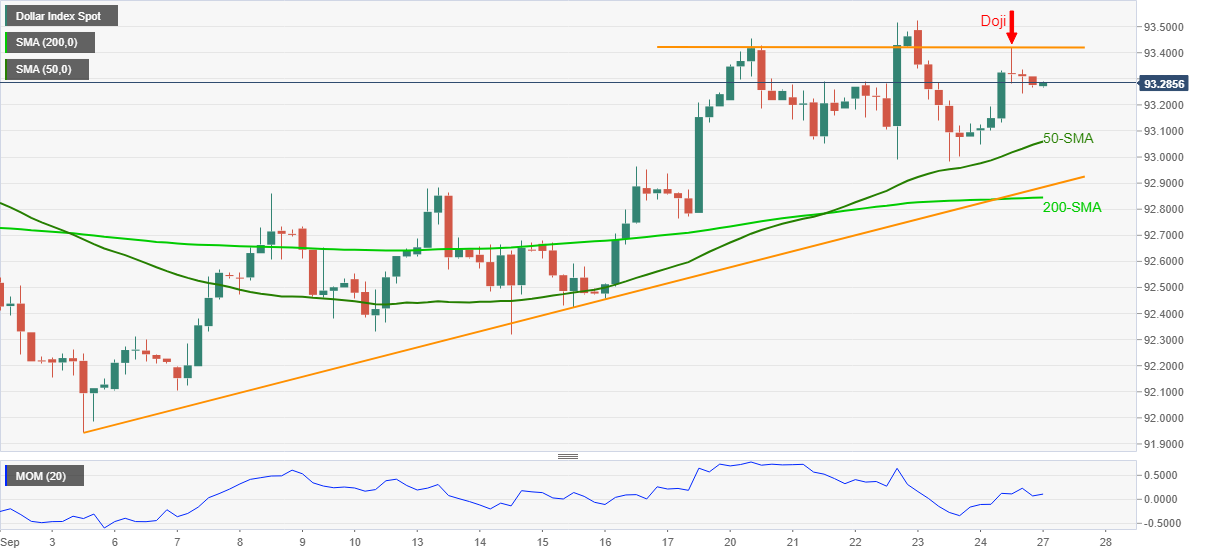
- Friday’s Doji, sluggish Momentum line favor short-term weakness.
- 50-SMA, three-week-old support line challenge bears ahead of 200-SMA.
- Bulls need to cross weekly horizontal resistance for fresh entry.
US Dollar Index (DXY) retreats towards 93.00, drops to 93.26 during Monday’s Asian session. In doing so, the greenback gauge portrays a struggle to extend the previous three-week uptrend while extending late Friday’s pullback moves.
It’s worth noting that the bearish Doji candlestick around the one-week-old horizontal line joins downbeat Momentum to hint at further consolidation of the recent gains towards retesting 50-SMA near the 93.00 threshold.
However, any further weakness will be challenged by an ascending support line from September 03 and 200-SMA, respectively around 92.88 and 92.84.
In a case where the US Dollar Index drops below 92.84, the mid-month bottom of 92.32 will be in focus.
On the flip side, recovery moves will be doubted unless crossing the stated horizontal resistance near 93.42.
Following that, the monthly high of 93.52 and the yearly peak, marked in August, close to $93.72, should return to the charts.
DXY: Four-hour chart
Trend: Pullback expected