24 Sep 2021
AUD/USD Price Analysis: Daily golden 61.8% ratio under pressure
- AUD/USD bulls are pressing up against a wall of resistance.
- AUD/USD bears looking to the 4-hour W-formation's neckline.
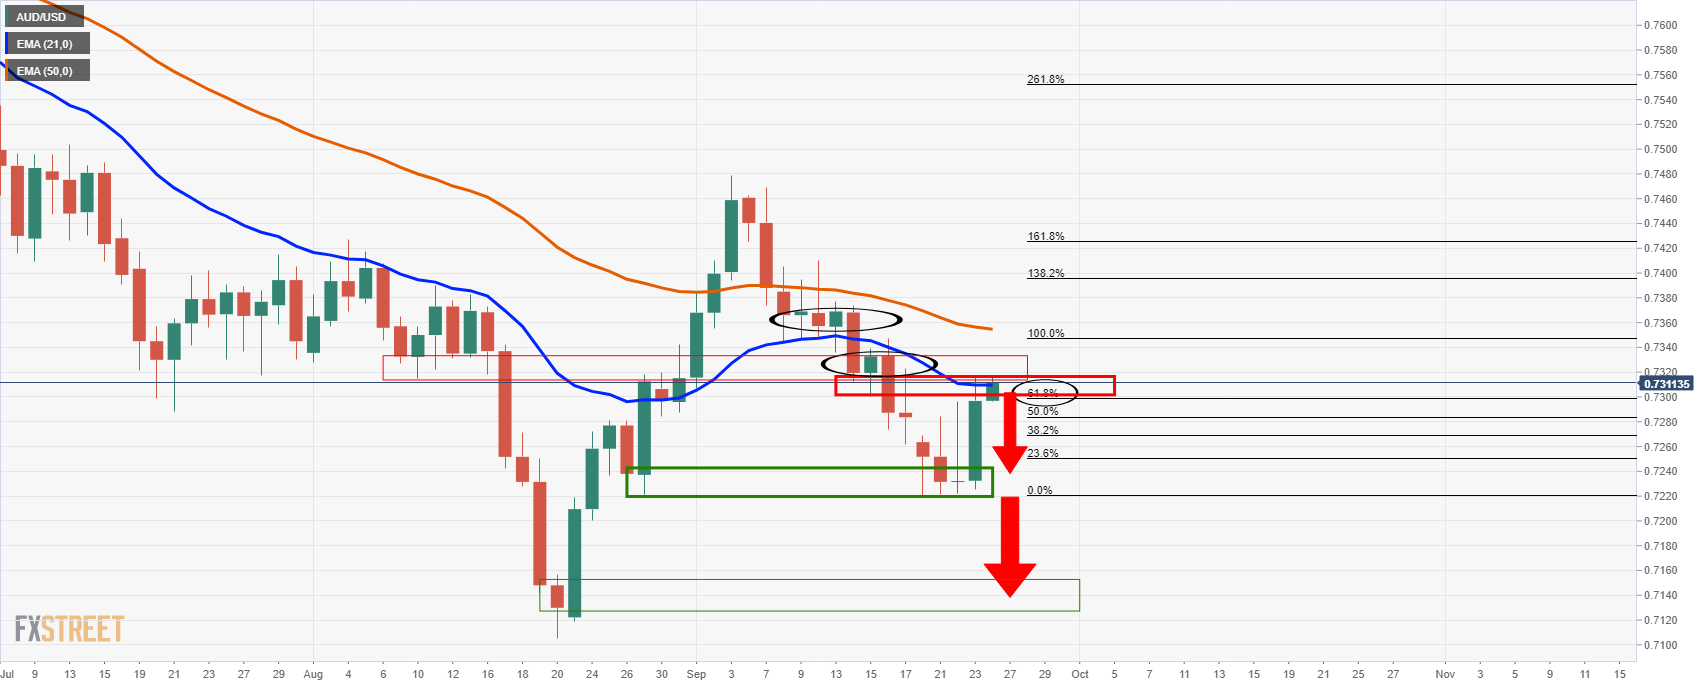
In a 61.85 Fibonacci retracement, AUD/USD is testing the bearish commitments near the 0.73 figure following heavy buying on Thursday. Bulls are moving in on the 0.7320 resistance and near to the 21-day moving average and the summer support.
The 21 or the 50-day moving averages would be expected to be tough resistance and failures would likely lead to a downside continuation for the coming days.
The following illustrates the structure of the market on the daily and 4-hour time frames.
AUD/USD daily chart
AUD/USD 4-hour chart
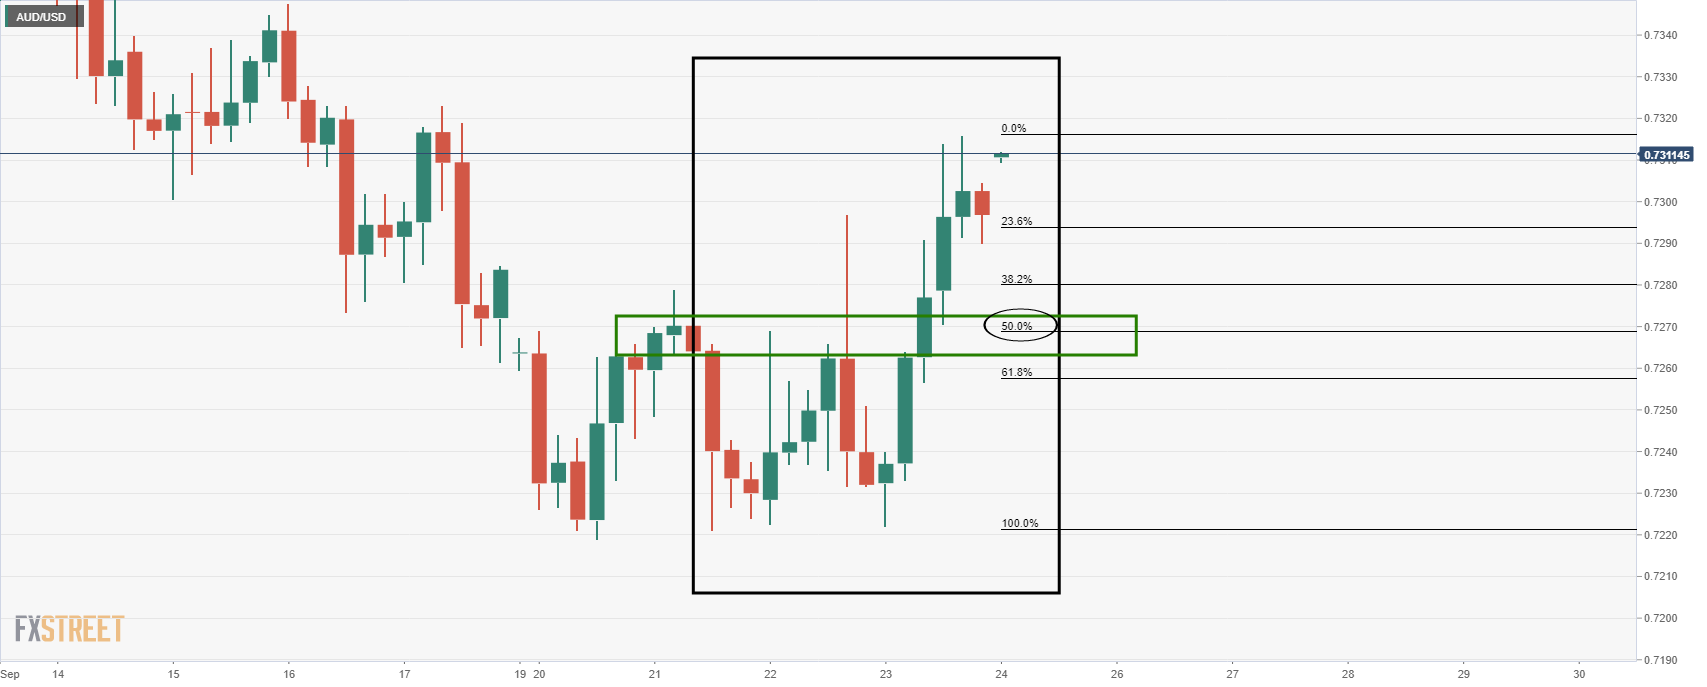
The 4-hour time frame shows a W-formation, a reversion pattern whereby the price would be expected to revert to the neckline of the formation. The neckline is located near a 50% mean reversion near 0.7270.