Gold Price Forecast: XAU/USD braces for three-week downtrend towards $1,717 on firmer Treasury yields
- Gold consolidates the biggest daily losses in a week near early August levels.
- Risk appetite improves on Evergrande news, post-Fed rethink and vaccine/stimulus optimism.
- US Treasury yields should be watched carefully with eyes on China, second-tier data.
Gold (XAU/USD) bears take a breather around a six-week low, picking up bids to $1,744 during the early Asian session on Friday.
The yellow metal dropped the most in a week the previous day after the US 10-year Treasury yields printed the biggest daily jump in seven months, around 1.43% by the press time.
After an initially downbeat reaction to the US Federal Reserve’s (Fed) stint, the US bond yields rallied as traders reassessed the hawkish phenomenon of the US central banker. That said, the Fed left benchmark rates unchanged near 0.25% at the latest meeting but signaled rate hikes and tapering more seriously.
Elsewhere, fading fears that China’s struggled real-estate firm Evergrande is a serious threat to the economy plays a key role. The firm got restructuring plans and showed readiness to pay a scheduled coupon while also gained government support to lift the sentiment.
It’s worth noting that progressing talks over the US $3.5 trillion stimulus and vaccine optimism adds to the risk-on mood.
That said, Wall Street portrayed a rosy picture of the market sentiment while the S&P 500 Futures rise 0.10% at the latest.
It should be observed that softer prints of the US preliminary PMI readings for September couldn’t recall gold buyers, neither did the US Dollar Index (DXY) slump on Thursday, the biggest in a month.
Moving on, gold traders need to pay close attention to the US Treasury yields for fresh impulse while US New Home Sales for August, expected 0.7M versus 0.708M prior, may offer extra clues.
Technical analysis
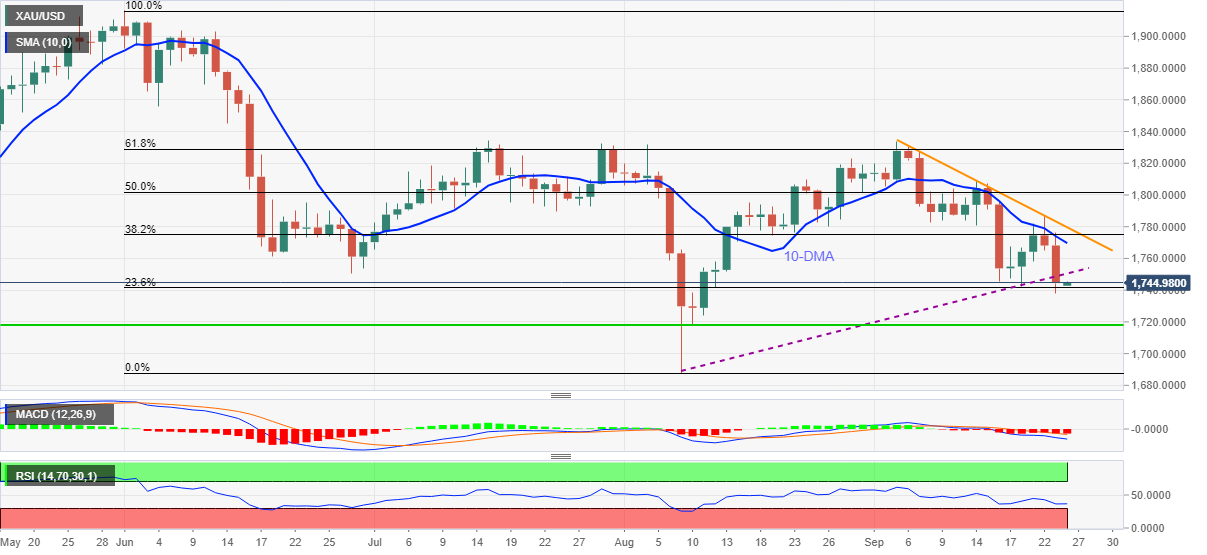
Despite bouncing off 23.6% Fibonacci retracement (Fibo.) of the June-August downside, gold prices keep the previous day’s break of a six-week-old support line, now resistance around $1,750.
Also favoring sellers are the bearish MACD signals and sustained trading below 10-DMA, as well as a descending trend line from September 03.
It should be noted, however, that the August 10 low near $1,717 may challenge the gold bears past 23.6% Fibo. level of $1,741 as RSI inches close to the oversold conditions.
Should the metal drops below $1,717, the $1,700 threshold and the yearly low near $1,687 will return to the charts.
Meanwhile, an uptick beyond the support-turned-resistance near $1,750, will be probed by the 10-DMA level of $1,770 and a three-week-long resistance line close to $1,780.
Following the upside break of $1,780, the 50% and 61.8% Fibonacci retracement levels, respectively around $1,801 and $1,829, may entertain the gold buyers ahead of challenging then with the $1,834 double tops.
Overall, gold prices remain bearish but $1,717 will be a tough nut to crack for the sellers.
Gold: Daily chart
Trend: Further weakness expected