AUD/USD Price Analysis: Falling wedge support, oversold RSI test bears around 0.7250
- AUD/USD remains pressured around three-week low, inside bullish chart pattern.
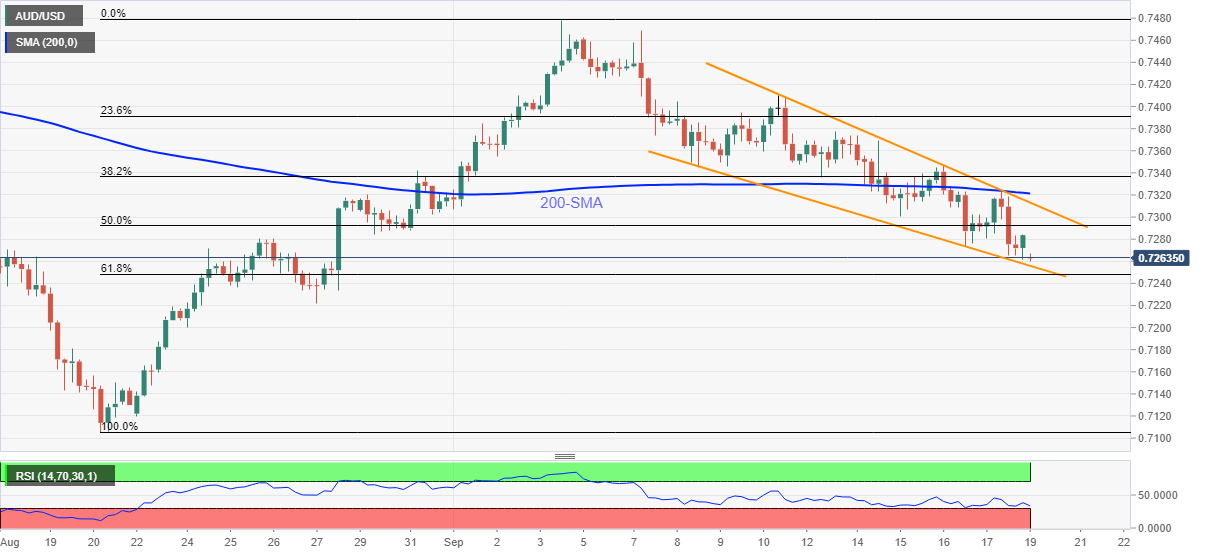
- Oversold RSI, immediate support line hints at corrective pullback.
- 200-SMA adds filters to the upside, 61.8% Fibonacci retracement challenges the bears.
AUD/USD stays depressed around 0.7260, down 0.28% on a day while fading bounce off intraday low amid Monday’s Asian session.
The Aussie pair flirts with the support line of a bullish chart pattern called falling wedge amid nearly oversold RSI conditions.
Hence, a corrective pullback towards the 0.7300 threshold can’t be ruled out. However, the upper line of the stated wedge, near 0.7315, followed by the 200-SMA level of 0.7321, will challenge the AUD/USD recovery moves afterward.
It should be noted, however, that a clear run-up beyond 0.7321 enables bulls to aim for the monthly top near 0.7480 with the 0.7400 psychological magnet acting as an intermediate halt.
Meanwhile, a downside break of 0.7255 nearby support line will have a 61.8% Fibonacci retracement level of August-September upside, around 0.7245, as an extra filter to the south.
Following that, August 27 swing low near 0.7220 and the 0.7200 round figure may entertain AUD/USD bears before directing them to August lows near 0.7105.
AUD/USD: Four-hour chart
Trend: Short-covering expected