USD/CAD Price Analysis: Firmer above 1.2600 on falling wedge confirmation
- USD/CAD stays mildly bid around intraday high after confirming a bullish chart pattern.
- 50-SMA guards immediate upside ahead of Friday’s top.
- One-month-old rising trend line adds to the downside filters.
USD/CAD picks up bids to 1.2625, justifying the previous day’s bullish breakout, ahead of Wednesday’s European session.
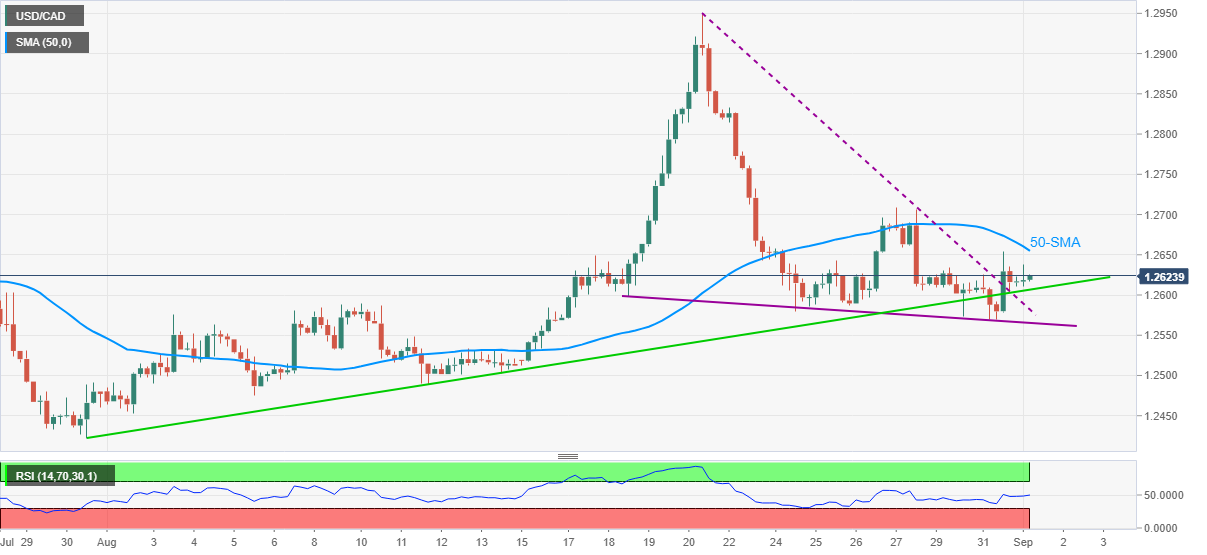
By crossing a downward sloping trend line from August 20, USD/CAD confirmed a bullish chart pattern called falling wedge the previous day. In doing so, the quote also jumped back beyond a monthly support line amid firmer RSI conditions.
Hence, buyers are on the way to battle 50-SMA for one more time, around 1.2655, ahead of challenging Friday’s top near 1.2706.
In a case where the USD/CAD bulls remain dominant past 1.2706, 1.2815 and 1.2830 may offer an intermediate halt during the rally targeting August month’s peak of 1.2949.
Meanwhile, an ascending trend line from July 30, near 1.2605, offers immediate support to the pair ahead of the stated wedge’s lower line close to 1.2565.
If at all the USD/CAD bears keep reins past 1.2565, which is less likely, multiple levels around 1.2490 can challenge the further downside before highlighting July’s bottom surrounding 1.2420.
USD/CAD: Daily chart
Trend: Further upside expected