WTI Price Analysis: Drops to test 100-HMA once again, API in focus
- WTI fails to sustain the uptrend above $69, turns into the red zone.
- The US oil challenges the key 100-HMA support at $68.19.
- Bearish RSI suggests more losses in the offing, with eyes on API data.
WTI (NYMEX futures) is snapping its two-day advance on Tuesday, reversing towards the $68 mark, as investors assess the impact of the hurricane IDA ahead of Thursday’s OPEC+ meeting.
The black gold is shrugging off the broad US dollar weakness, as profit-booking seems to be the main theme heading into the American Petroleum Institute’s (API) weekly crude stockpiles data.
From a short-term technical perspective, WTI bears are back in control after the bulls failed to find acceptance above the $69 threshold earlier this Tuesday.
The renewed downside pressure knocked off WTI firmly below the horizontal 21 and 50-hourly moving averages (HMA), as the bears now challenge the ascending 100-HMA at $68.19.
The risks remain to the downside, as the Relative Strength Index (RSI) is pointing south below the midline.
If the 100-HMA support gives way, then a drop towards Monday’s low of $67.6 remains inevitable.
Further south, the upward-sloping 200-HMA at $66.35 could be on the sellers’ radar.
WTI: Hourly chart
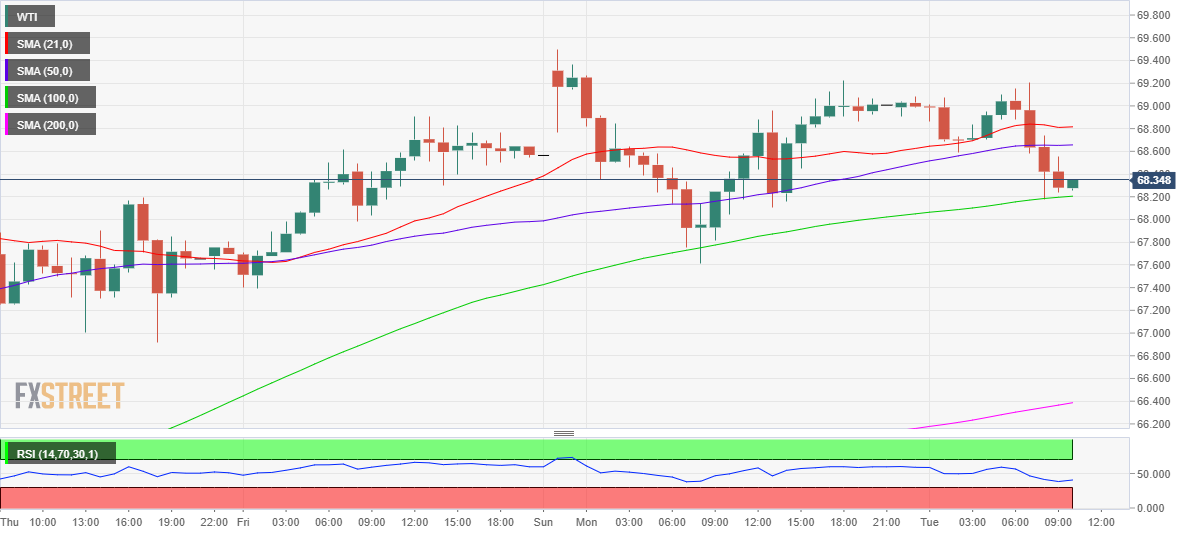
On the upside, acceptance above the 50-HMA at $68.65 to recapture the 21-HMA hurdle at $68.81.
However, only an hourly close above the $69 mark could call for a sustained upswing towards the $70 psychological level.
WTI: Additional levels to watch