US Dollar Index Price Analysis: DXY bears brace for 92.50
- DXY seesaws around two-week lows, keeps downside break of short-term rising trend line, 200-SMA.
- Bearish MACD signals favor sellers, bulls need to cross 13-day-old hurdle to retake controls.
US Dollar Index (DXY) struggles for a clear direction, pressured of late, during Monday’s Asian session.
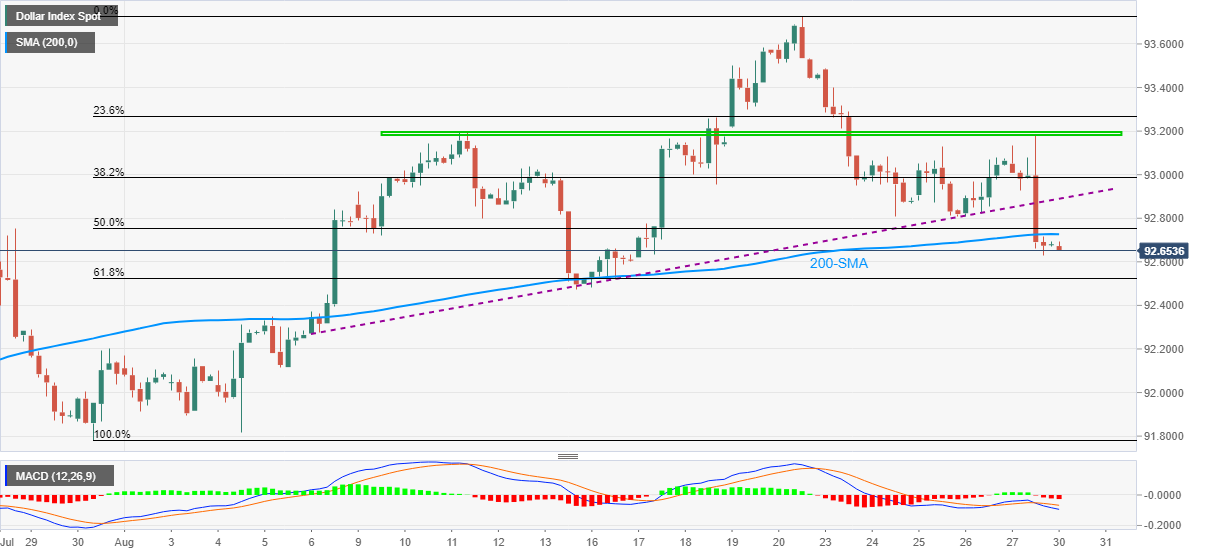
Even so, the bears remain hopeful as Friday’s heavy fall conquered an ascending support line, now resistance, as well as the 200-SMA level. Also favoring the sellers are the MACD signals.
However, 61.8% Fibonacci retracement of July 30 to August 20 upside, near 92.52, followed by the August 13 swing low of 92.47, will challenge the bears during the DXY’s further weakness.
Should the quote remains weak past 92.47, July end’s swing high around 92.20, the 92.00 threshold and the last month’s trough near 91.78 will be in focus.
Alternatively, 200-SMA and the previous support line, respectively around 92.72 and 92.90, will restrict the quote’s short-term upside during a corrective pullback.
Even if the quote rises past 92.90, a horizontal area from August 11, near 93.20, will be the key for DXY bull’s entry.
DXY: Four-hour chart
Trend: Further downside expected