US Dollar Index Price Analysis: DXY bulls brace for 93.20 hurdle
- DXY stays on the front foot after rising the most in a week the previous day.
- Upbeat Momentum, successful U-turn from 20-DMA favor bulls.
- Five-month-old horizontal line adds to the upside filters.
US Dollar Index (DXY) takes the bids around 93.11, up 0.06% intraday, during Friday’s Asian session. The greenback gauge jumped the most since August 19 the previous day after bouncing off 20-DMA.
The recovery moves take clues from the upward sloping Momentum line to keep DXY bulls hopeful.
However, a horizontal line comprising the double tops marked during July and early August around 93.20 challenges the optimists.
Even if the US Dollar Index crosses 93.20, March’s top near 93.45 will probe the bulls ahead of directing them to the monthly peak of 93.72.
Meanwhile, an upward sloping trend line from June 01, around 92.93, offers immediate support ahead of the 20-DMA level of 92.83.
Should DXY closed below 92.83, the mid-month low of 92.48 and the monthly bottom surrounding 91.80 will gain the bear’s attention.
DXY: Daily chart
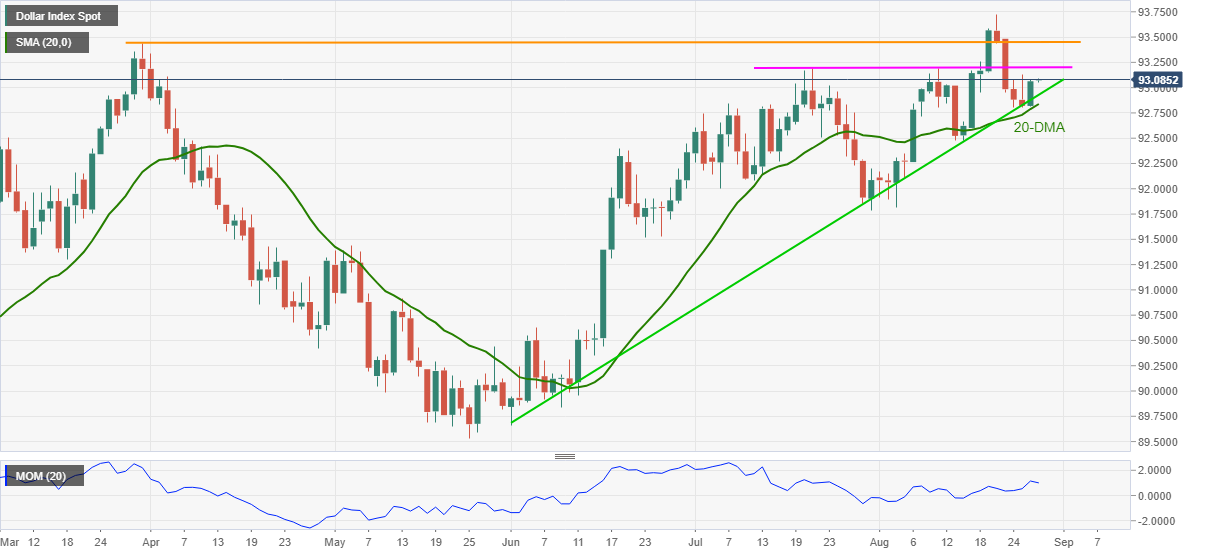
Trend: Further upside expected