Copper Price Analysis: Recovery remains capped below 200-SMA
- Copper steps back from 50-SMA, two-week-old horizontal resistance.
- Receding bullish bias of MACD signals pullback to weekly support line.
- One-month-old descending trend line adds to the upside filters, bears have a bumpy road ahead of March’s low.
Alike other commodities, copper prices also print mild losses, down 0.37% intraday around $4.2200 heading into Tuesday’s European session.
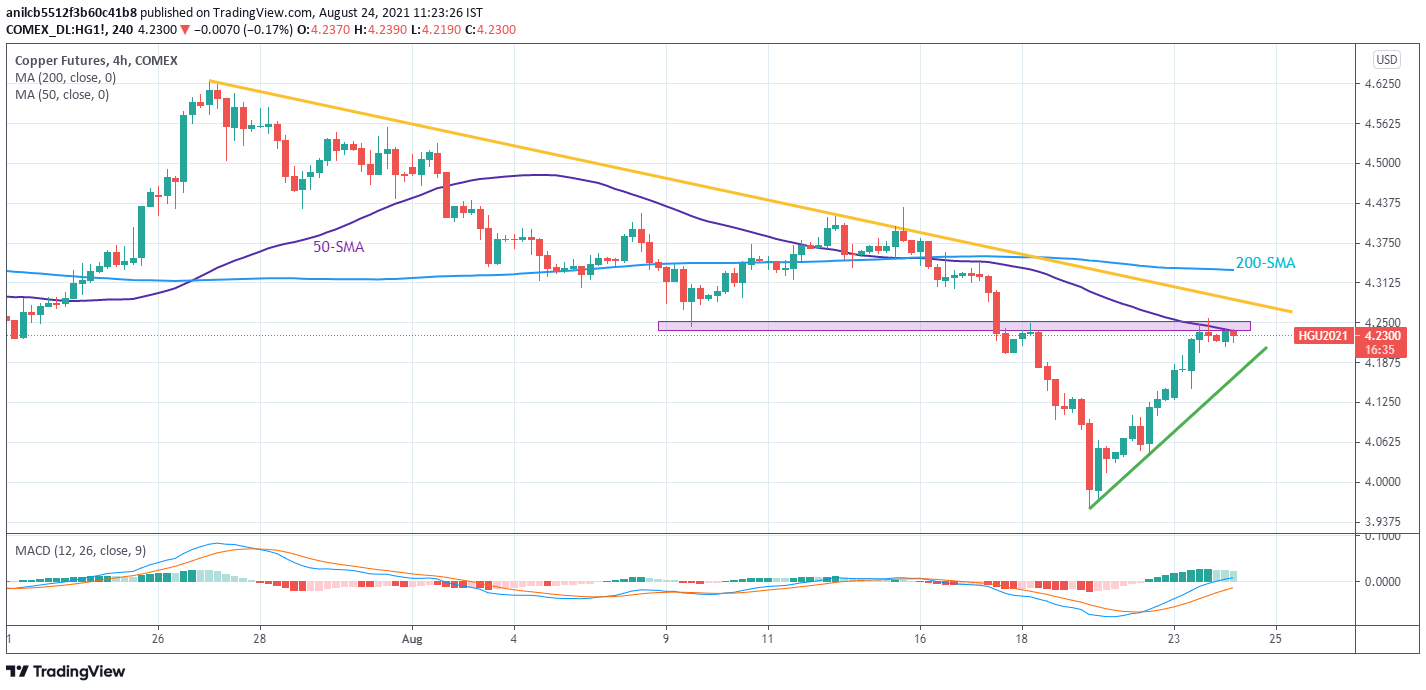
In doing so, the red metal steps back from a short-term horizontal area around $4.2350–2530 comprising multiple levels marked since August 09, as well as 50-SMA.
The pullback moves also join recently easing bullish bias of the MACD signals to keep sellers hopeful.
Even if copper crosses the $4.2530 hurdle, the monthly resistance line and 200-SMA, respectively around $4.2850 and $4.3330, will challenge the bulls.
Alternatively, a one-week-old rising trend line near $4.1625, followed by the $4.1000 threshold, guards the metal’s short-term downside.
It’s worth noting that the monthly low of $3.9600 and March’s bottom near $3.8500 become strong supports that challenge copper’s weakness past $4.1000.
Price of copper: Four-hour chart
Trend: Pullback expected