AUD/USD Price Analysis: Finds support near 0.7100 mark, bearish bias intact
- AUD/USD prolonged its recent bearish trajectory and dropped to fresh multi-month lows.
- Oversold conditions on short-term charts helped limit any further losses, at least for now.
- Sustained weakness below the 0.7100 mark will set the stage for additional near-term losses.
The AUD/USD pair dropped to the lowest level since November 2020 on Friday, though managed to find some support near the 0.7100 mark. The pair was last seen trading around the 0.7125-30 region, still down over 0.25% for the day.
The worsening COVID-19 situation in Australia, along with the prevalent risk-off environment turned out to be a key factor that continued weighing on the perceived riskier aussie. Apart from this, expectations that the Fed will begin rolling back its pandemic-era stimulus acted as a tailwind for the safe-haven US dollar and further exerted pressure on the AUD/USD pair.
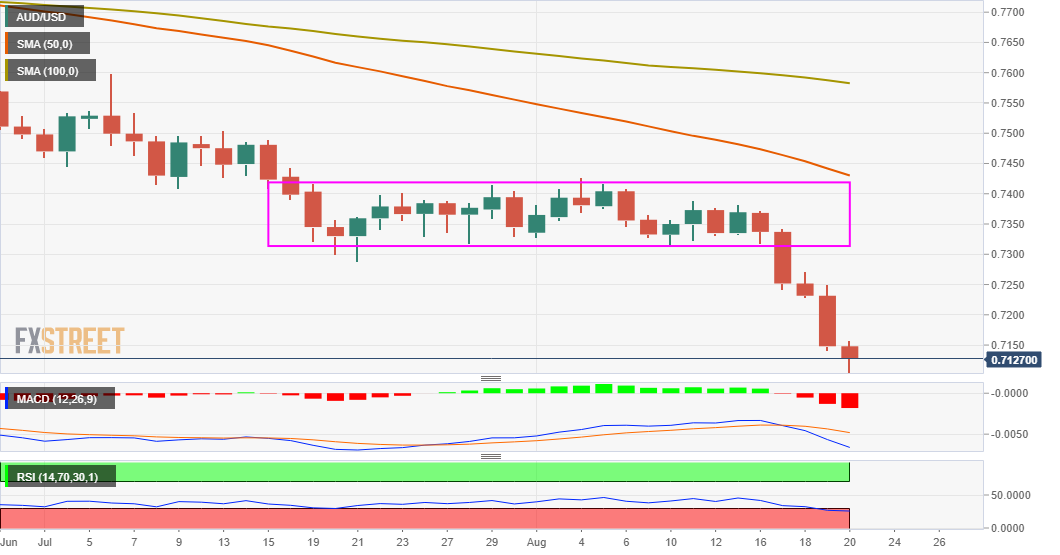
From a technical perspective, this week's slide below a one-month-old trading range support confirmed a fresh bearish breakdown and dragged the AUD/USD pair lower for the fifth consecutive session. However, oversold conditions on short-term charts held traders from placing fresh bearish bets and extended some support to the major/helped limit further losses, at least for now.
That said, the AUD/USD pair's inability to register a meaningful recovery suggests that the near-term bearish trajectory might still be far from being over. Hence, any subsequent move up might still be seen as a selling opportunity near the 0.7150-55 region. Some follow-through buying might prompt some short-covering move and allow the pair to aim back to reclaim the 0.7200 mark.
Conversely, bearish traders might now wait for sustained weakness below the 0.7100 round figure before positioning for any further depreciating move. The AUD/USD pair might then accelerate the downfall towards intermediate support near the 0.7040-30 region before eventually dropping to the key 0.7000 psychological mark.
AUD/USD daily chart
Technical levels to watch