USD/CAD Price Analysis: 61.8% Fibonacci retracement probes bulls amid overbought RSI
- USD/CAD takes the bids near the highest levels since February.
- Upside break of five-month-old resistance keeps buyers hopeful.
- Overbought RSI conditions may trigger a pullback from the key Fibonacci retracement level.
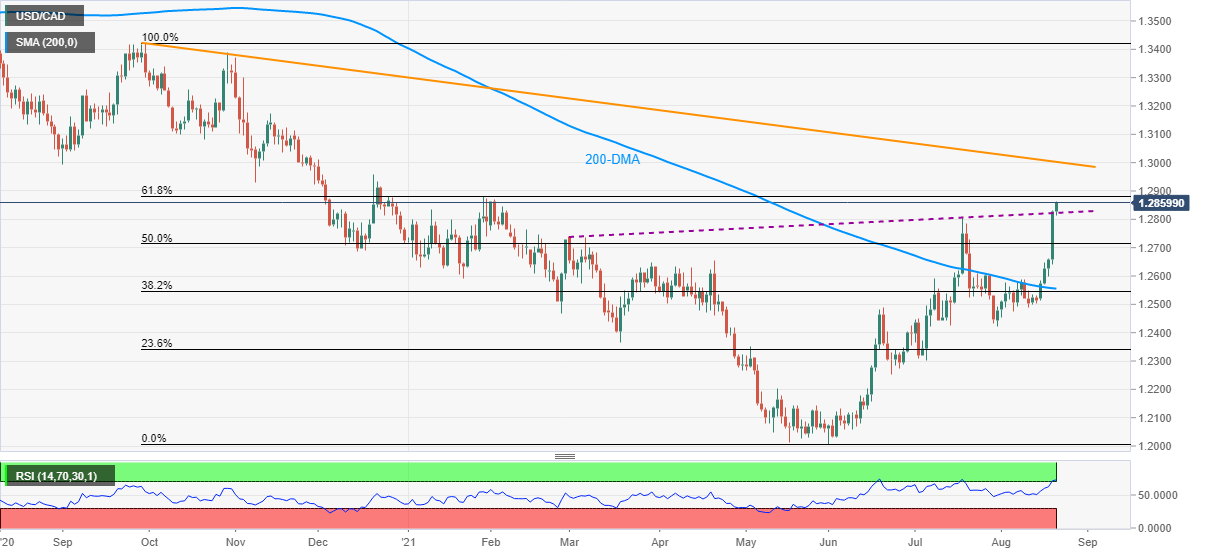
USD/CAD pokes February high around 1.2860, up 0.22% intraday, during early Friday. In doing so, the Loonie pair stays positive for the fifth consecutive day, also up after positing the heaviest daily gains in 14 months, by the press time.
While the quote’s successful break of an ascending resistance line from March 03, around 1.2820, favor buyers, overbought RSI conditions signal a pullback.
As a result, 61.8% Fibonacci retracement of the pair’s late 2020 to the mid-2021 downside, near 1.2880, becomes an immediate important resistance to watch.
Should the quote rises past 1.2880, a descending trend line from September 2020, near the 1.3000 threshold, will be in focus.
Alternatively, a daily closing below the resistance-turned-support, around 1.2820, will drag the USD/CAD prices to July’s top near 1.2800.
However, any further weakness will make USD/CAD vulnerable to decline towards 50% Fibonacci retracement and April’s high, respectively around 1.2710 and 1.2650.
USD/CAD: Daily chart
Trend: Pullback expected