Gold Price Forecast: XAU/USD keeps sight on $1800 and $1805 ahead of Fed minutes – Confluence Detector
- USD’s pullback, covid concerns keep gold price buoyed ahead of Fed minutes.
- Gold price advances towards $1800 but the rebound in yields poses a risk.
- Gold Price Forecast: $1800 testing bullish commitments, Fed minutes hold the key
After a temporary breather on Tuesday, bulls are back in the game this Wednesday, driving gold price closer towards the $1800 mark. The US dollar has paused its two-day uptrend, as the risk sentiment is improving, despite the looming fears over the coronavirus spread on the global economic recovery. Traders are repositioning heading towards the July Fed meeting’s minutes due on the cards at 1800 GMT. The Fed minutes is likely to provide fresh insights on the US central bank’s tapering plans. Looking ahead, the rebound in the Treasury yields could limit the upside attempts in gold price.
Read: FOMC Minutes July Preview: More new questions than answers
Gold Price: Key levels to watch
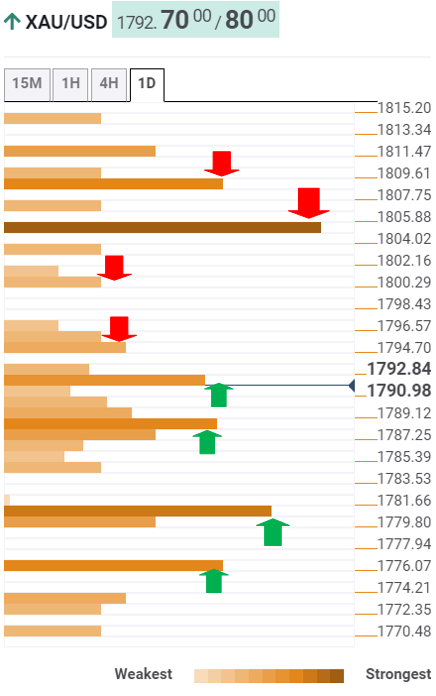
The Technical Confluences Detector shows that gold is fast approaching a dense cluster of healthy resistance levels around $1795, where the previous day’s high converges with the SMA200 four-hour and pivot point one-day R1.
The next resistance awaits at the SMA50 one-day at $1798, above which $1802 (pivot point one-day R2) could challenge the bulls.
Acceptance above the Fibonacci 161.8% one-day at $1805 is needed to unleash additional upside towards the Fibonacci 38.2% one-month at $1808.
Alternatively, the immediate downside target for gold bears is aligned near the $1787 region, which is the confluence zone of the Fibonacci 38.2% one-day, SMA100 four-hour and Fibonacci and the previous low four-hour.
Another strong cap is seen at previous day’s and week’s lows around $1780.
If the bearish interests pick up momentum, then the pivot point one-month S1 at $1776 could come to the rescue of gold bulls.
Here is how it looks on the tool
About Technical Confluences Detector
The TCD (Technical Confluences Detector) is a tool to locate and point out those price levels where there is a congestion of indicators, moving averages, Fibonacci levels, Pivot Points, etc. If you are a short-term trader, you will find entry points for counter-trend strategies and hunt a few points at a time. If you are a medium-to-long-term trader, this tool will allow you to know in advance the price levels where a medium-to-long-term trend may stop and rest, where to unwind positions, or where to increase your position size.