AUD/USD Price Analysis: Bulls struggle at key daily resistance
- AUD/USD is trapped at a critical market structure within a sideways channel.
- The US dollar is the driving seat that could perk up again to prevent further gains.
As per the prior analysis, AUD/USD Price Analysis: Bulls taking charge within sideways trading conditions, the market has indeed moved in to test the resistance of the 10-EMA and market structure.
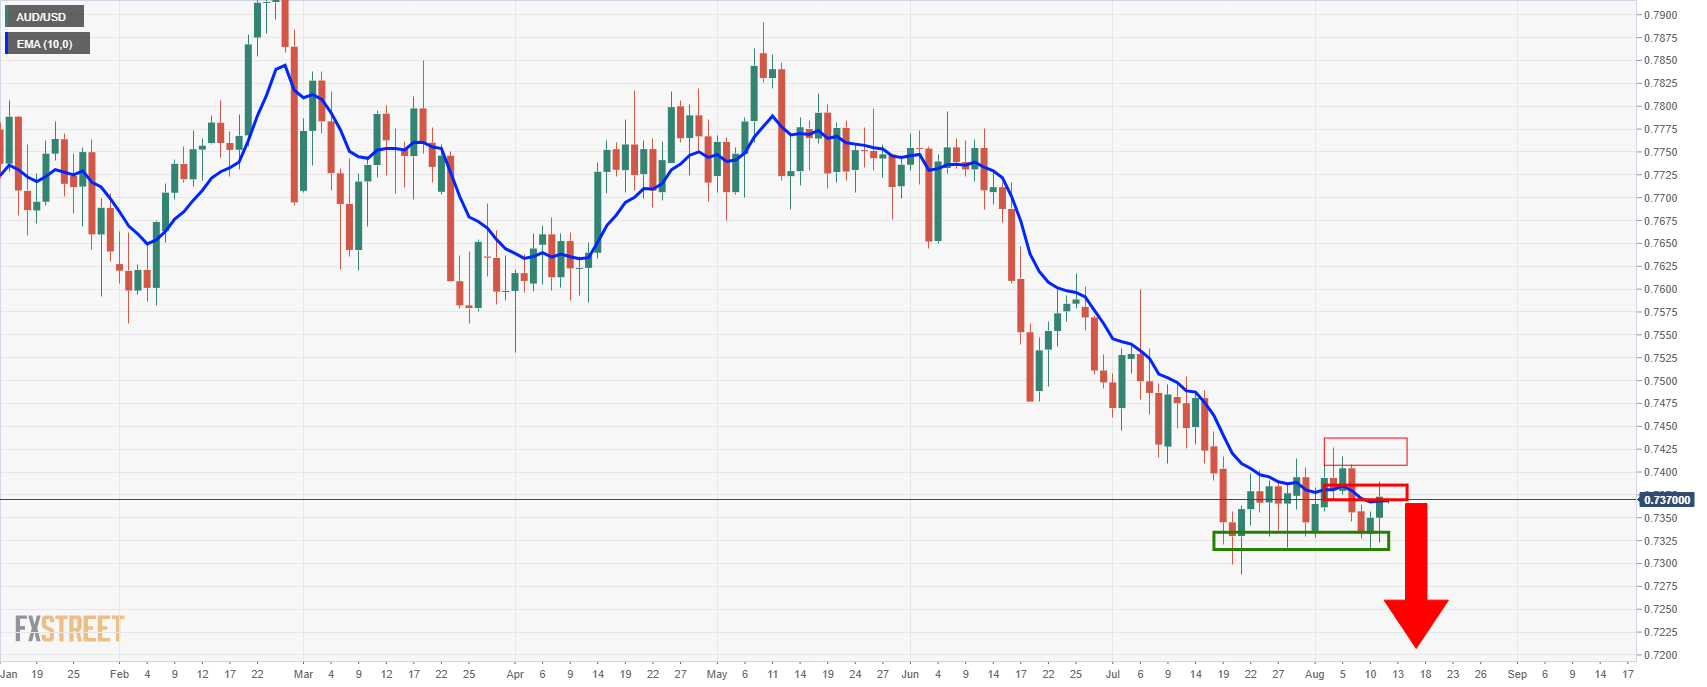
Daily chart, prior analysis
The daily chart shows that the price is supported in the low 0.73s and moving within a sideways range between there and the resistance in the high 0.73 areas.
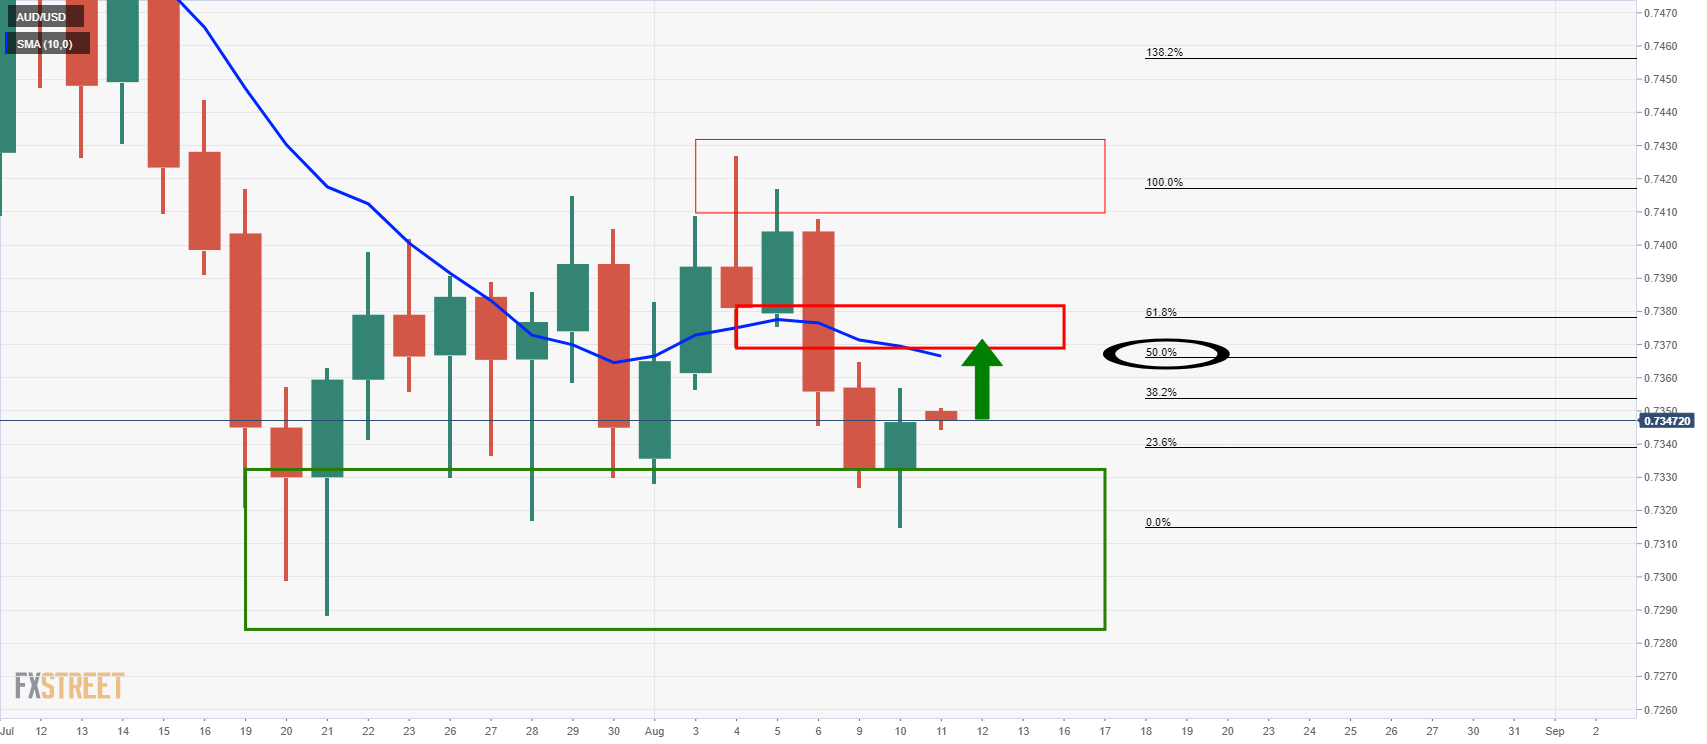
The 10 EMA aligns with old support and a 50% mean reversion level in the 0.7360s would be expected to be retested in the coming sessions.
Live market analysis, daily chart
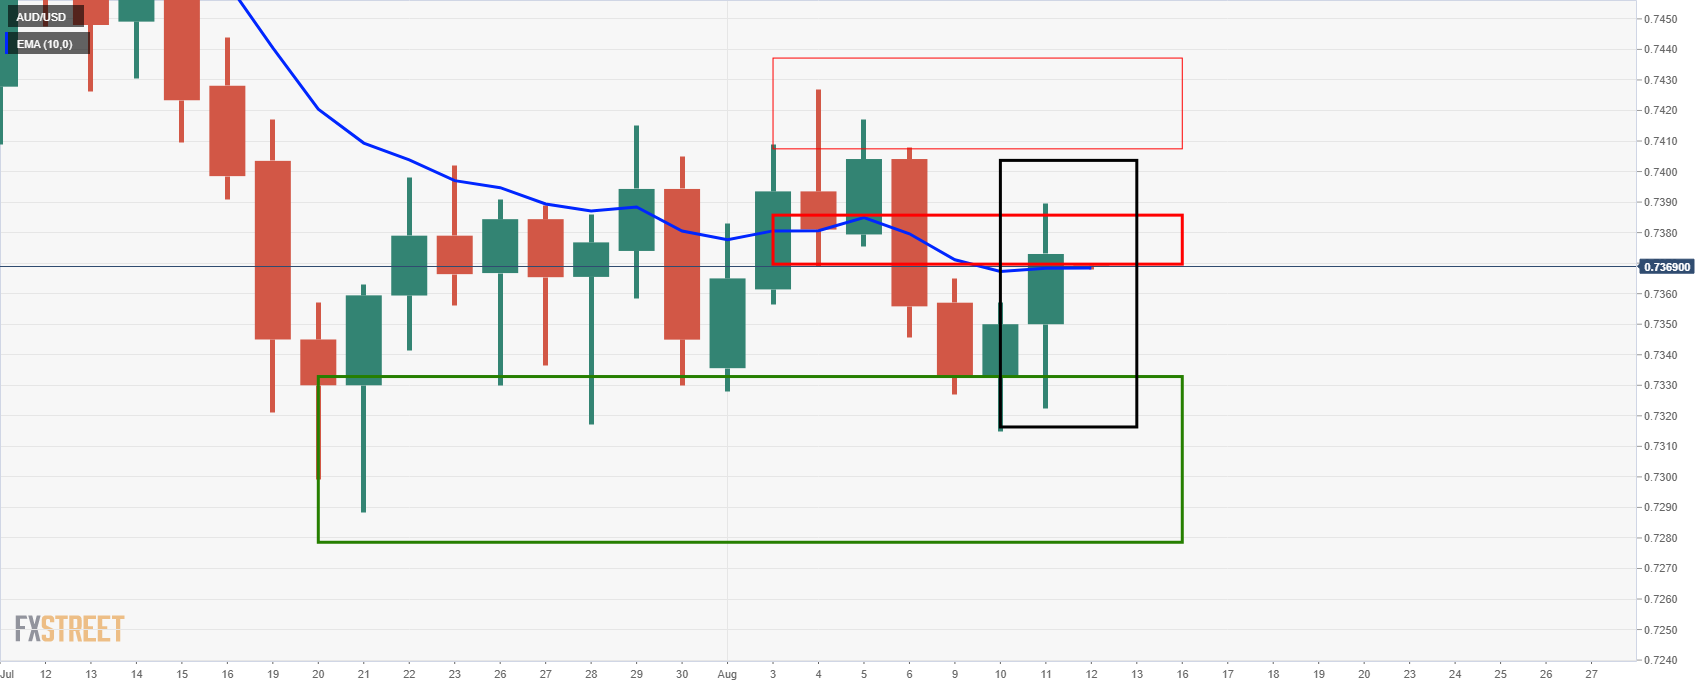
The bulls have tested the 10-d EMA but their fate will be left in the hands of investor's appetite for the greenback:
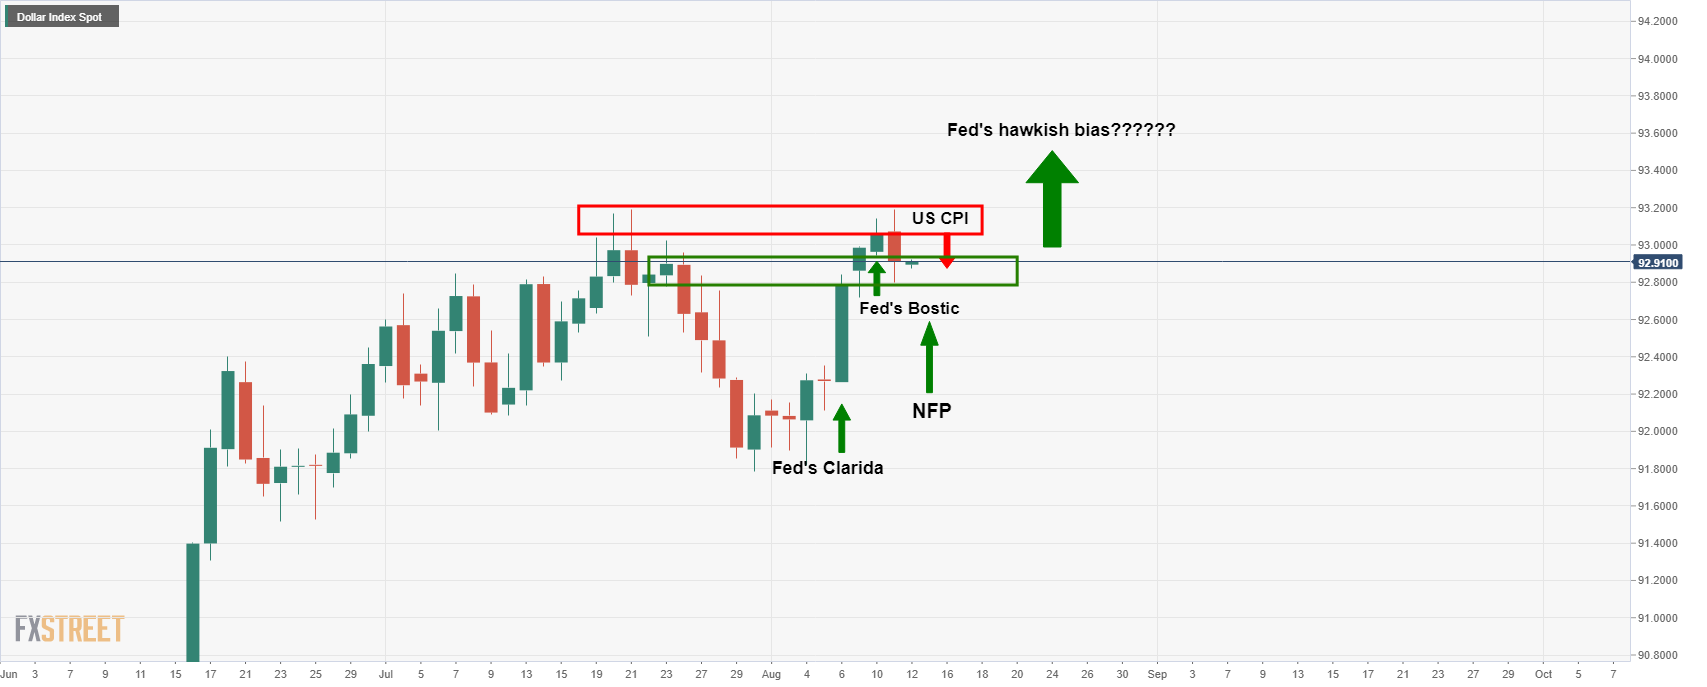
The above chart is the DXY index which has been propelled into the 93 areas of late from hawkish undertones at the Federal Reserve.
A continuation to the upside of much of the same over the remainder of the month will weigh on the commodity complex and AUD, exposing risks of a breakout to the downside in a continuation of the prevailing bearish trend: