USD/CNH Price Analysis: Buyers finds it difficult to break $6.48 level
- USD/CNH edges lower on Monday post-Chinese higher inflation data.
- Price takes refuge just above the 20-day SMA on the daily chart.
- Momentum oscillator fades upside momentum, warns against aggressive bets.
USD/CNH fails to sustain the previous day’s gain on Monday and retreats from the higher levels. The pair opened higher albeit fizzled out rather quickly to touch the intraday low at 6.4756.
At the time of writing, USD/CNH is trading at 6.4768, down 0.10% for the day.
USD/CNH Daily chart
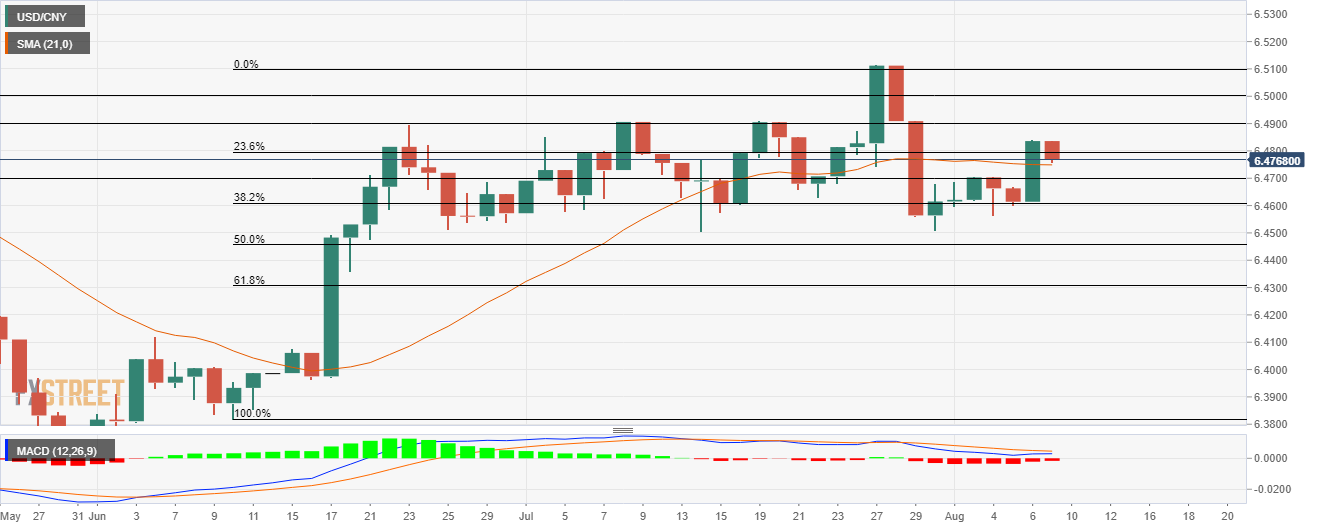
On the daily chart, the pair has been facing stiff resistance near the 6.4900 level for more than one month, where the downside is capped near 38.2% Fibonacci retracement. The Fibonacci retracement extends from the lows of 6.3819.
If price breaks the 20-day Simple Moving Average (SMA) at 6.4748, it could move further down toward the 6.4700 horizontal support level.
The receding Moving Average Convergence Divergence (MACD) indicator signifies the underlying bearish sentiment in the pair. Any downtick in the MACD would amplify the selling opportunity till 38.2% Fibboanci retracement at 6.4610.
In doing so, USD/CNH would further move down toward the low made on August 4 at 6.4562.
Alternatively, a reversal in price movement would try to test the multiple resistance formation at the 6.4900 resistance level.
A daily close above the mentioned level would confirm the dominance of the bulls over the price action.
Next, the market participants keep their eye on the 6.5000 horizontal resistance level followed by the high of July 28 at 6.5114.
USD/CNH additional levels