Gold Price Forecast: XAU/USD steadies above $1,800 ahead of key events
- XAU/USD stages a rebound after dipping below $1,800.
- 10-year US Treasury bond yield stays flat following the note auction.
- Gold Price Weekly Forecast: XAU/USD bulls bet on Golden Cross pattern, uptrend support, lower yields.
The XAU/USD pair started the new week under modest bearish pressure and dropped toward $1,800 during the European trading hours. With the greenback preserving its strength in the early American session, gold dropped to a fresh six-day low of $1,791 but didn't have a difficult time erasing its losses. As of writing, the pair was down 0.18% on a daily basis at $1,805.
In the absence of high-tier macroeconomic data releases and fundamental developments, the risk-averse market environment helped the greenback find demand. Reflecting the broad-based USD Strength, the US Dollar Index climbed to a daily high of 92.42 and forced XAU/USD to remain on the back foot.
Nevertheless, with the S&P 500 Index notching a new all-time high after the opening bell, the USD lost interest and paved the way for a recovery in gold prices.
Meanwhile, the benchmark 10-year US Treasury bond yield struggles to preserve its bullish momentum after rising more than 5% on Friday and allowing XAU/USD to stay afloat above $1,800. The 10-year Treasury note auction that took place on Monday received decent demand with a high yield rate of 1.371%, compared to 1.497% in the previous auction.
On Tuesday, the Consumer Price Index (CPI) data from the US will be watched closely by market participants. In May, the CPI jumped to 5% on a yearly basis and provided a boost to the USD. The CPI is expected to decline to 4.9% in June and a stronger-than-expected reading is likely to help the greenback outperform its rivals and vice versa.
Starting Wednesday, FOMC Chairman Jerome Powell will deliver the Fed’s semiannual report to Congress on the state of the US economy.
Gold technical outlook
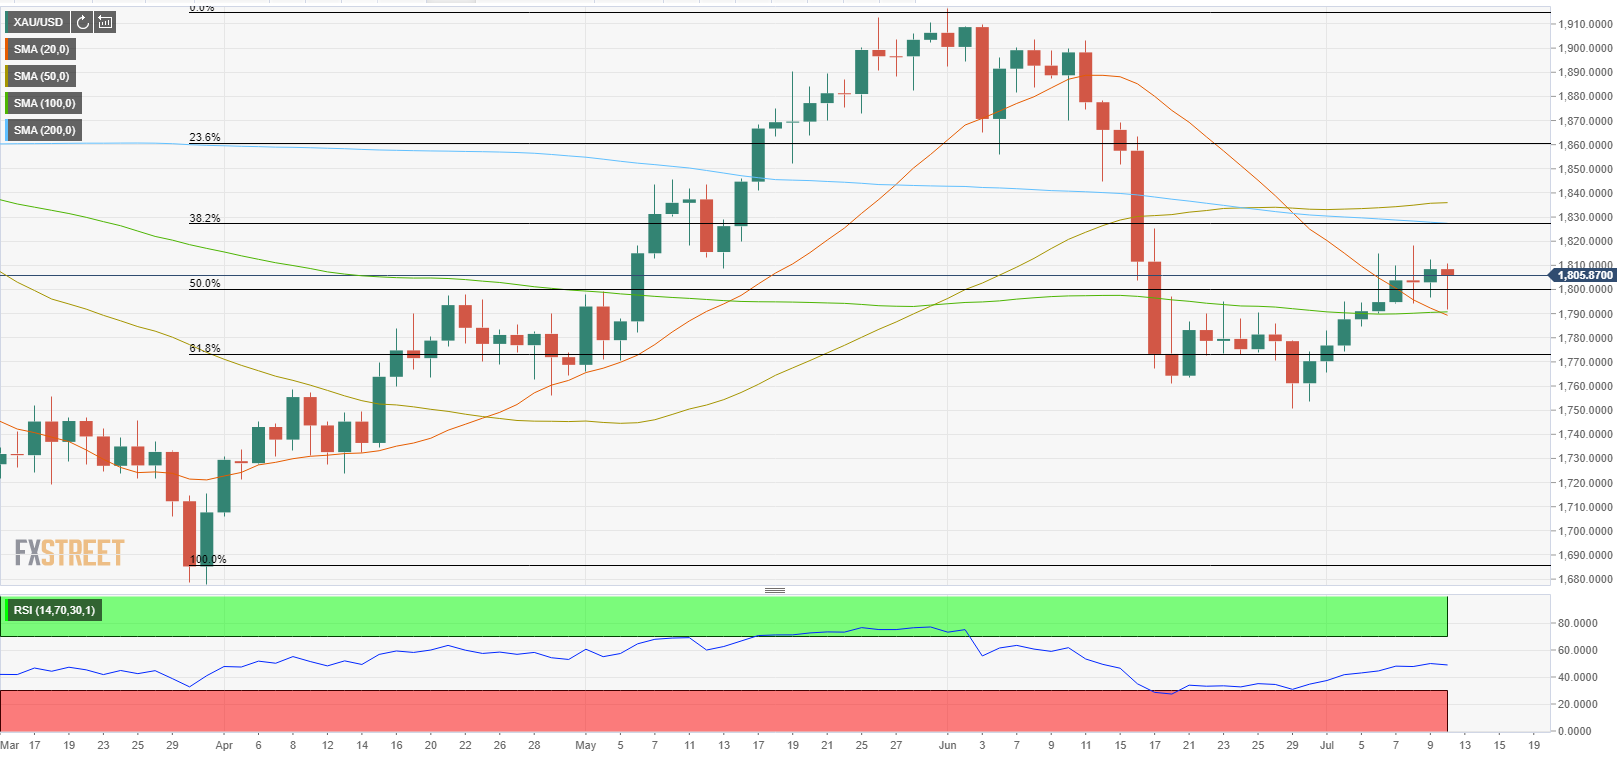
Monday's price action reaffirms that buyers remain committed to defending $1,800, where the Fibonacci 50% retracement of the April-June uptrend is located. Moreover, the Relative Strength Index (RSI) indicator on the daily chart continues to hold above 50, suggesting that sellers are having a difficult time retaining control. The next significant resistance is located at $1,820 (200-day SMA, Fibonacci 38.2% retracement) ahead of $1,835 (50-day SMA).
On the downside, a daily close below $1,800 could open the door for additional losses toward the 100-day SMA at $1,790. In case gold breaks below that level, the near-term outlook could turn bearish with the next target aligning at $1,770 (Fibonacci 61.8% retracement).
Additional levels to watch for