25 Jun 2021
US Dollar Index Price Analysis: Key support remains at the mid-91.00s
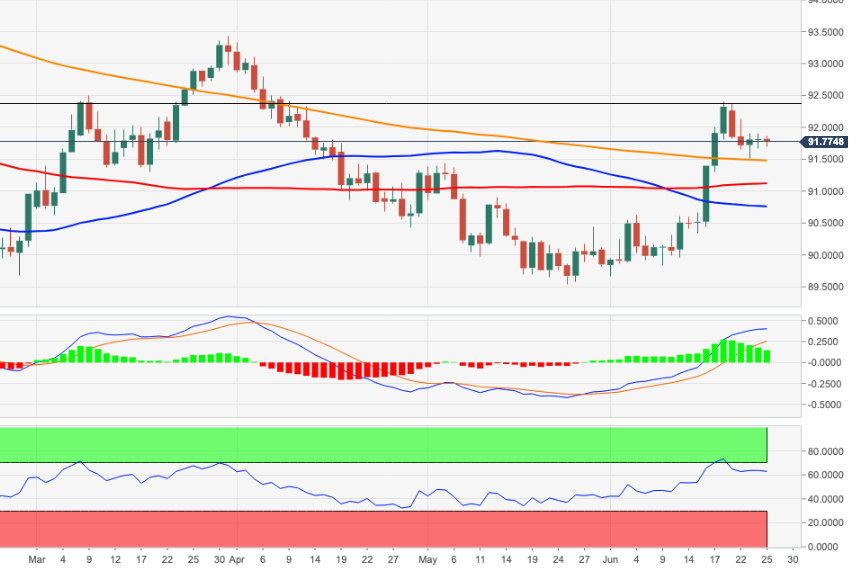
- DXY extends the consolidation below the 92.00 yardstick.
- The 200-day SMA near 91.50 emerges as a key support.
DXY moves within a rangebound pattern in the lower end of the weekly range, always in the sub-92.00 area.
If the selling impulse gathers extra steam, then another visit to the critical 200-day SMA, today at 91.48, should not be ruled out.
In the meantime, and looking at the broader scenario, a sustainable breakout of the 200-day SMA should shift the outlook for the buck to positive.
DXY daily chart