Gold Price Analysis: XAU/USD seesaws below $1,800, immediate rising wedge keeps sellers hopeful
- Gold picks up bids from the intraday low, stays close to the highest levels since February flashed earlier in Asia.
- Bearish chart formation near multi-day top, downbeat MACD signals suggest pullback moves.
- One-week-old rising trend line, $1,760 support confluence will test gold bears.
Gold reverses the latest pullback moves from multi-day top while taking rounds to $1,794 ahead of Thursday’s European session. Even so, the yellow metal stays inside a bearish chart pattern, rising wedge, on the hourly formation.
Not only the bearish formation but the downbeat MACD conditions and the commodity’s indecisive moves around the two-month high also back the odds of the pullback.
However, a clear break of $1,788 becomes necessary to confirm the wedge formation and aim for levels marked during April 14-15 around $1,750-49.
During the fall, a seven-day-old support line and an area comprising 200-HMA, respectively around $1,770 and $1,760, can offer intermediate stops.
Meanwhile, an upside clearance of $1,800 will defy the bearish chart formation, which in turn highlights late February tops near $1,816 on the gold buyer’s radar.
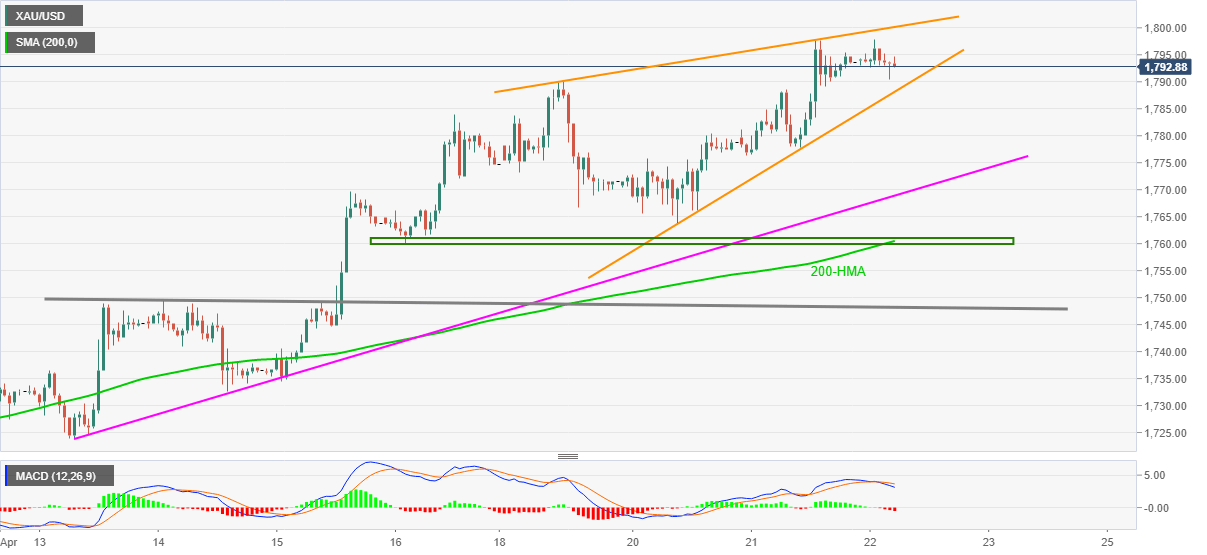
Gold hourly chart
Trend: Pullback expected