GBP/USD Price Analysis: Clings to 200-HMA inside one-week-old rising channel
- GBP/USD pauses after three-day uptrend, stays inside bullish chart pattern.
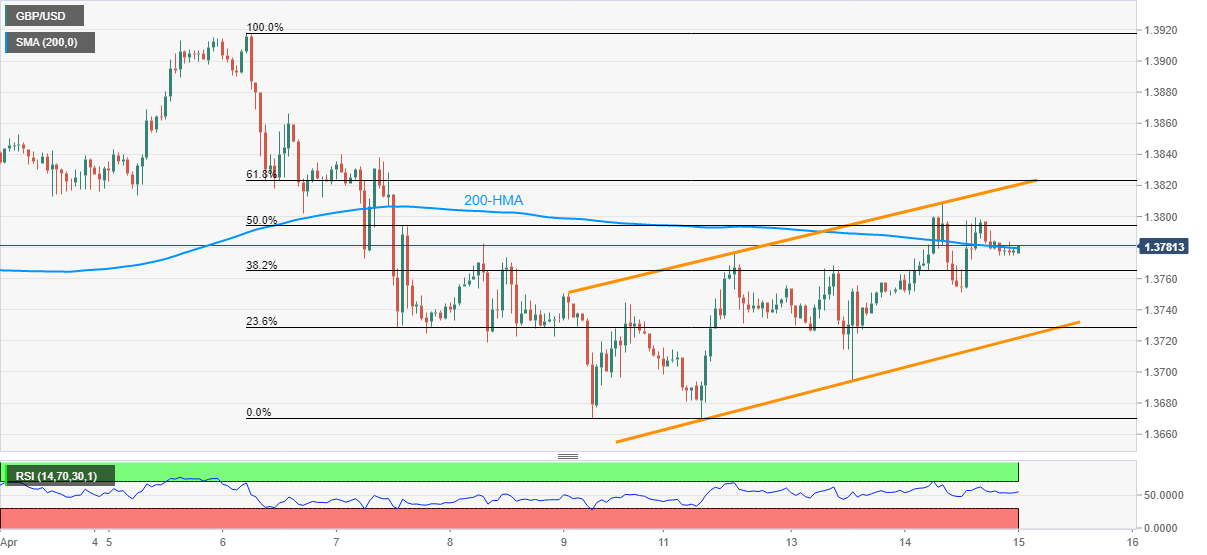
- Strong RSI, bounce off 1.3750 favor buyers but the key Fibonacci retracements test further upside.
GBP/USD flirts with an intraday low of 1.3774 amid Thursday’s Asian session. The cable rose to the highest since April 07 during the three-day rise the previous day.
In doing so, the pair portrays a short-term ascending trend channel formation. However, the quote’s latest moves have been compressed by 200-HMA.
Given the strong RSI and the pair’s successful recovery from 1.3750, not to forget the bullish chart pattern, GBP/USD is likely to remain strong with a 50% Fibonacci retracement level of April 06–12 downside, around 1.3795, acting as an immediate hurdle.
Should sterling prices rise beyond the 1.3800 threshold, the upper line of the stated channel, near 1.3820, quickly followed by a 61.8% Fibonacci retracement level of 1.3825, will gain the market’s attention.
Alternatively, a downside break of 1.3750 will test the channel’s support line, around 1.3720.
However, any further weakness past-1.3720 may not hesitate to challenge the double bottoms, marked during late March and early April, near 1.3670.
GBP/USD hourly chart
Trend: Further upside expected