Gold Price Analysis: XAU/USD clings to 200-HMA inside weekly triangle
- Gold eases inside a choppy range around the key moving average.
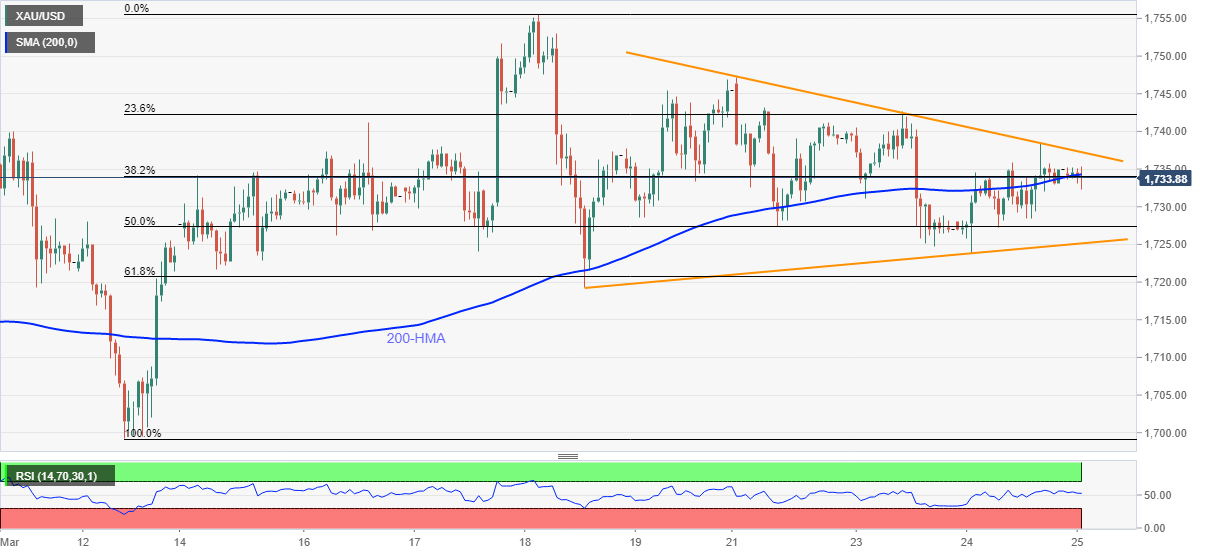
- Normal RSI conditions also tame directional moves between $1,725-38.
- 61.8% Fibonacci retracement, monthly high act as extra filters beyond the triangle.
Gold prices refrain from breaking the less than $5 intraday range, bouncing off lows to around $1,735 by the press time of early Thursday. In doing so the yellow metal stays bear near 200-HMA while funneling down the one-week-old symmetrical triangle.
Not only the triangle formation and rigid moves inside the key moving average, but RSI conditions also challenge the momentum traders.
Hence, the bullion moves are likely to pick-up pace only if breaking the $1,725 support or $1,738 resistance. Also acting as additional challenges to the precious metal traders are the 61.8% Fibonacci retracement of March 12-18 upside and the monthly peak, respectively around $1,720 and $1,755.
It should, however, be noted that the commodity’s failures to keep the early March recovery moves and the US dollar strength suggest brighter days for the bears.
Overall, gold prices are stuck in a small range and need a decisive push for clear direction.
Gold hourly chart
Trend: Sideways