GBP/USD Price Analysis: Bears battle two-week-old support line above 1.3900
- GBP/USD fades three-day downtrend, trades choppy above 1.3900 off-late.
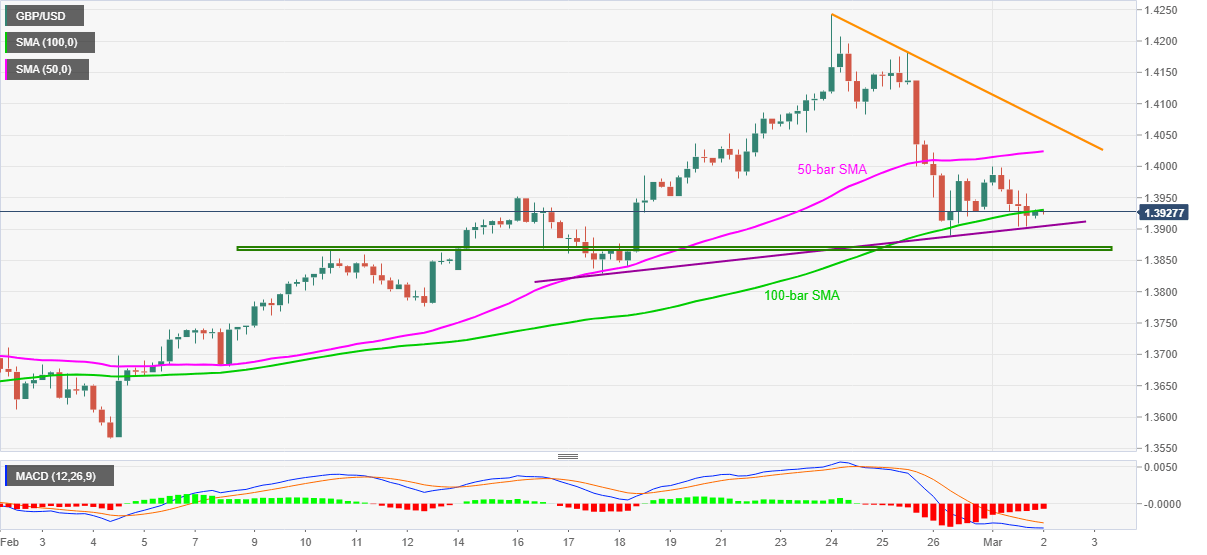
- 100-bar SMA adds to the immediate support, 50-bar SMA, weekly resistance line guard further recoveries.
- MACD seems to drop the bearish bias, repeated bounces off short-term support line also favor the bulls.
GBP/USD picks up bids around 1.3930, up 0.06% intraday, amid the initial Asian session on Tuesday. The cable dropped during the previous three days before recently bouncing off a short-term ascending trend line and 100-bar SMA.
The corrective pullback dims bearish MACD signals and hence suggests further upside towards the 1.4000 threshold. However, any further recoveries need to cross the 50-bar SMA level of 1.4025 and a falling trend line from February 24, currently around 1.4075, to convince sterling buyers.
Should GBP/USD prices manage to successfully cross 1.4075, the 1.4100 round-figure and 1.4185 can offer intermediate halts during the run-up to refresh the multi-month tops, marked the previous month, around 1.4245.
Alternatively, a clear downside below the stated support line, near 1.3900, will be challenged by three-week-old horizontal support around 1.3870-65.
Also acting as a downside filter for the GBP/USD pair is February 17 low near 1.3830.
Overall, GBP/USD eyes to regain the upside momentum but immediate hurdles test the bulls.
GBP/USD four-hour chart
Trend: Bullish