18 Feb 2021
USD/CAD Price Analysis: Back above 1.27 after testing 5-day SMA support
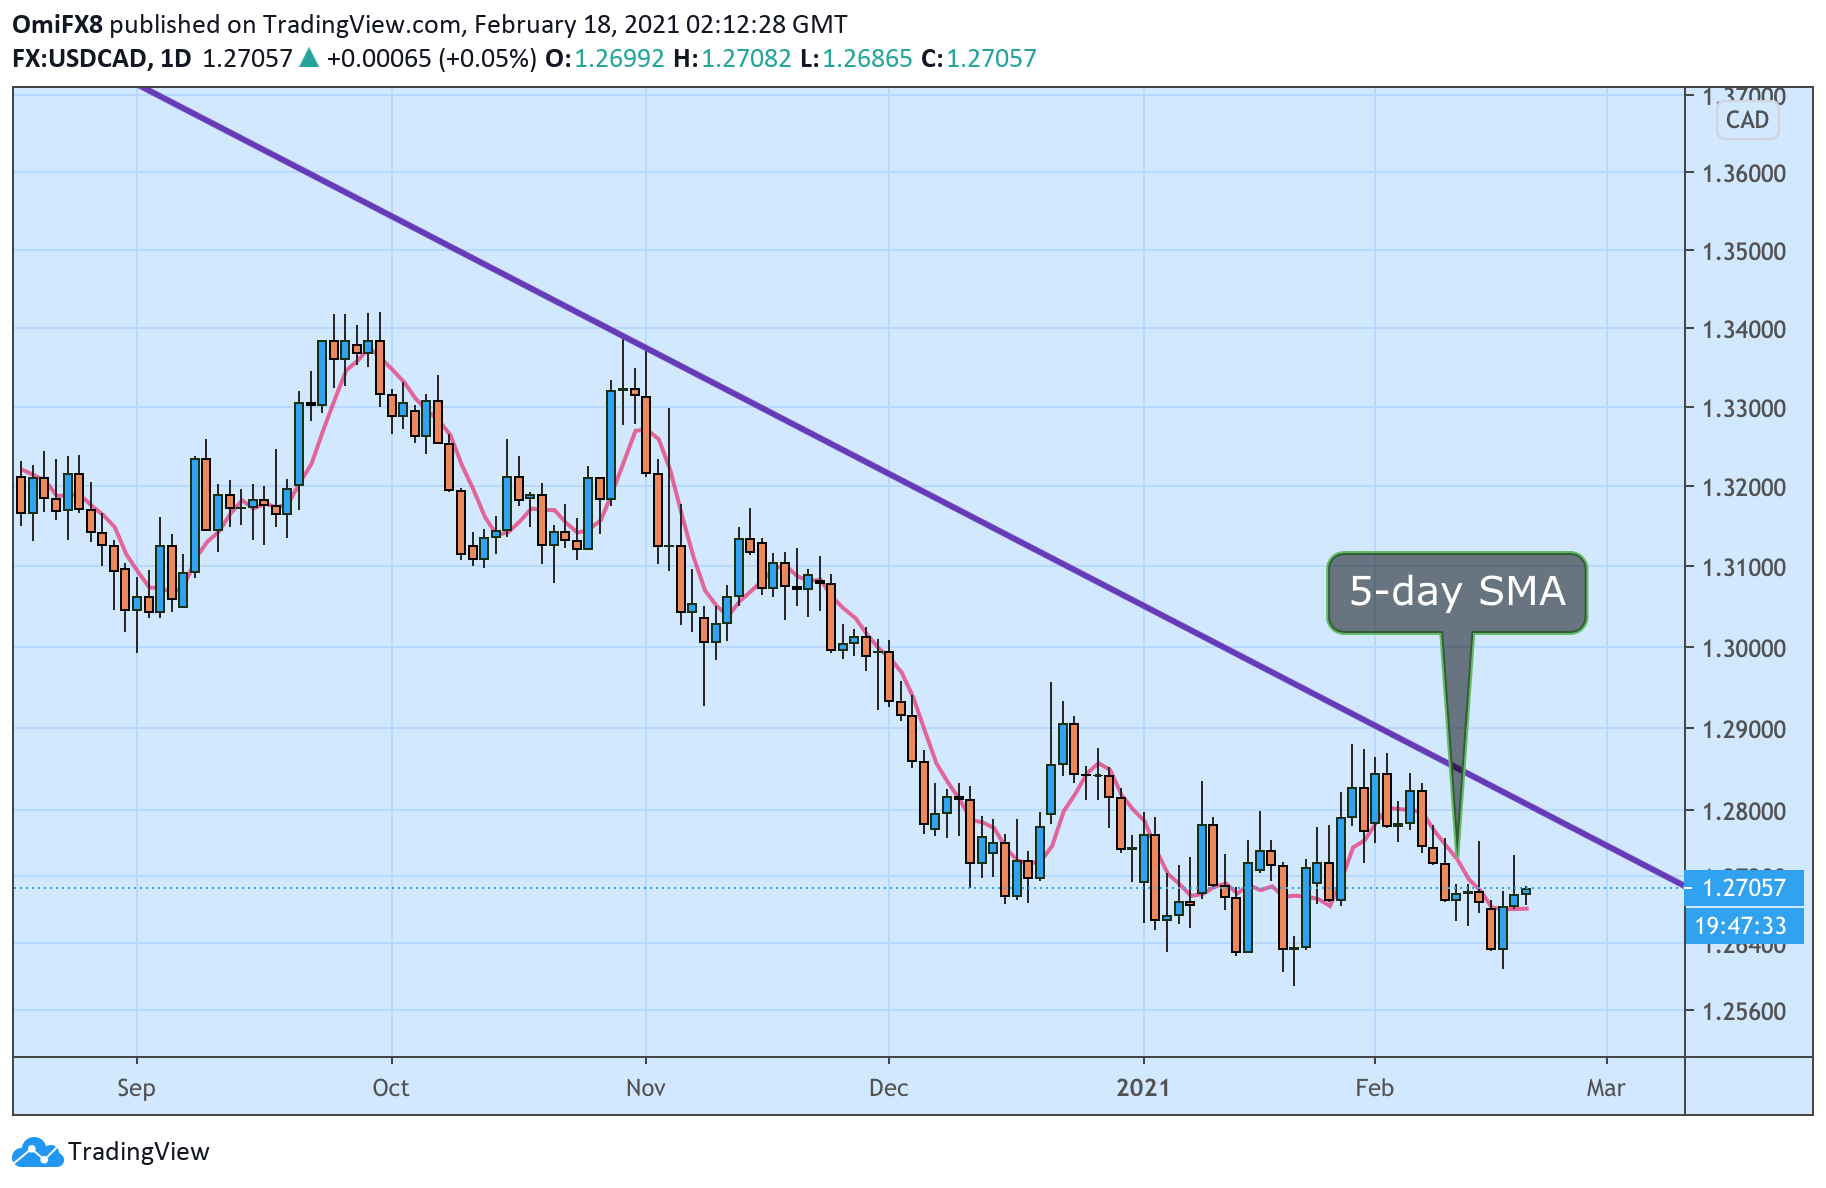
USD/CAD has bounced up from the 5-day Simple Moving Average support to print session highs above 1.27.
However, resistance at 1.2746 is still intact. A break above that level is needed to invalidate the bearish view put forward by the long upper wick attached to Wednesday's candle and expose the resistance of the trendline falling from March 2020 highs. At press time, the trendline hurdle is located at 1.28.
On the downside, Wednesday's low of 1.2682 is the level to defend for the bulls. A violation there would shift risk in favor of a re-test of 1.2610 (Feb. 16 low).
Daily chart
Trend: Neutral
Technical levels