US Dollar Index Price Analysis: DXY bears attack multi-month low below 90.00
- DXY bounces off intraday low of 89.73 in a corrective pullback amid two-day declines.
- Previous resistance line from early November offers immediate support.
- April 2018 low stays on the bears' radar unless breaking 21-day SMA.
US dollar index (DXY) drops the fresh low in two weeks while extending the previous day’s downtrend to 89.73, currently down 0.24% around 89.78, during early Wednesday.
In doing so, the greenback gauge bounces off the previous resistance line, now support, stretched from November 04 amid the bullish MACD. However, the indicator’s inability to cross 21-day SMA suggests the momentum weakness.
Ahead of the stated support line, previous resistance, around 89.70, the monthly low, also the lowest since April 2018, of 89.73, will also challenge the US dollar bears.
Hence, further selling of the DXY needs a clear break of 89.70 before eyeing the 32-month bottom surrounding 89.22 and the 89.00 round-figure.
Meanwhile, the 90.00 psychological magnet guards the greenback indicator’s immediate upside ahead of the confluence comprising December 04 low and 21-day SMA near 90.47/48.
In a case where the USD buyers manage to cross the 90.48 hurdle, the monthly high of 92.00 will gain the market’s attention.
DXY daily chart
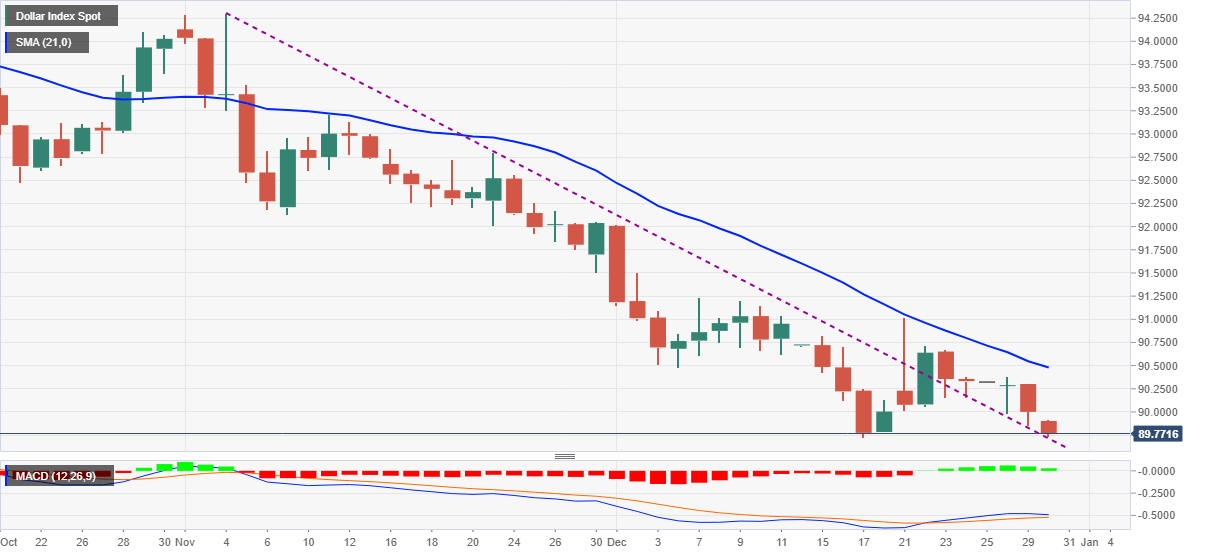
Trend: Pullback expected