WTI Price Analysis: March top lures the bulls as OPEC struggles over output hike
- WTI keeps upside break of 61.8% Fibonacci retracement, nears highest in nine months.
- OPEC struggles to agree over output even as some participants back a delay in the production hike.
- Ascending trend line from March adds to the upside filter.
WTI nears the end of November while revisiting the early-March tops, closed around $45.70 on Friday. The energy benchmark stays on the bull’s radar as upbeat fundamentals help the quote to remain strong beyond 61.8% Fibonacci retracement of January-April downside.
While the coronavirus (COVID-19) vaccine hopes favor the oil bulls, the recent indecision over the production hike delay at the OPEC and its allies (OPEC+) Joint Ministerial Monitoring Committee (JMMC).
Read: OPEC: No agreement to delay output hike, so far
Given the upside break of the key Fibonacci resistance gaining fundamental support, the black gold may extend its latest run-up towards the March month’s high of $48.74 amid bullish MACD.
However, an upward sloping trend line from March 11, currently around $49.30 and the $50.00 threshold can challenge the bulls afterward.
Alternatively, 61.8% Fibonacci retracement and a short-term support line from November 06, around $43.70/65, offers strong immediate support to the commodity.
Should WTI sellers manage to break $43.65 on a daily closing basis, the October high near $41.90 will flash on their radars.
WTI daily chart
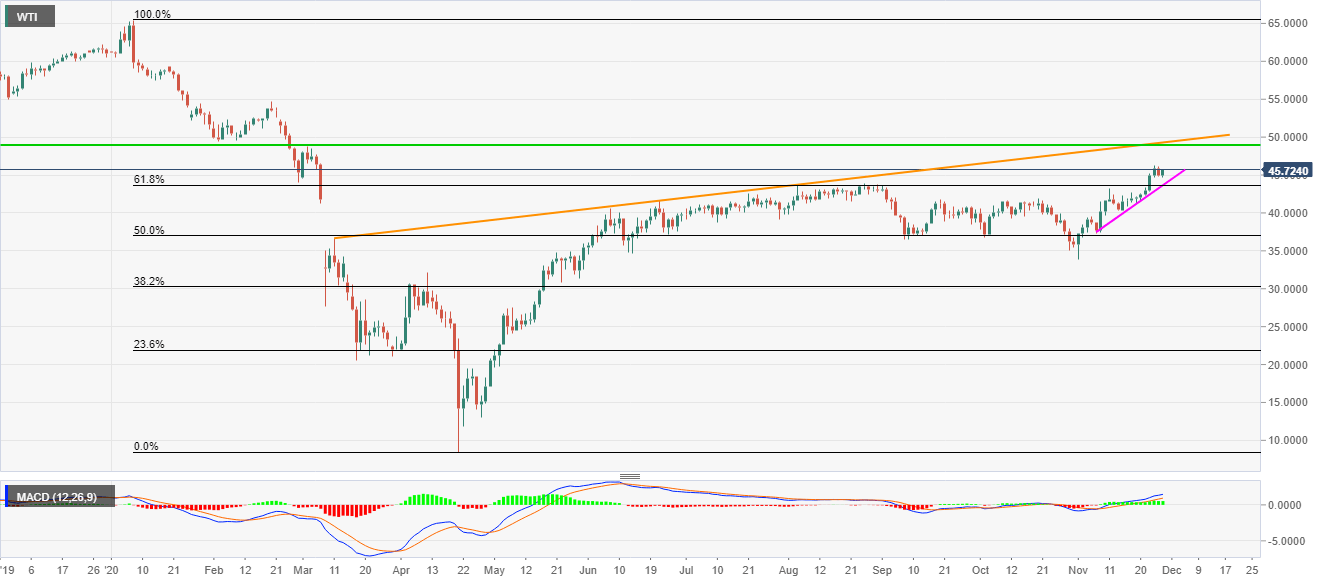
Trend: Bullish