GBP/USD Price Analysis: A test of 1.3400 still remains on the cards
- GBP/USD’s path of least resistance appears to the upside.
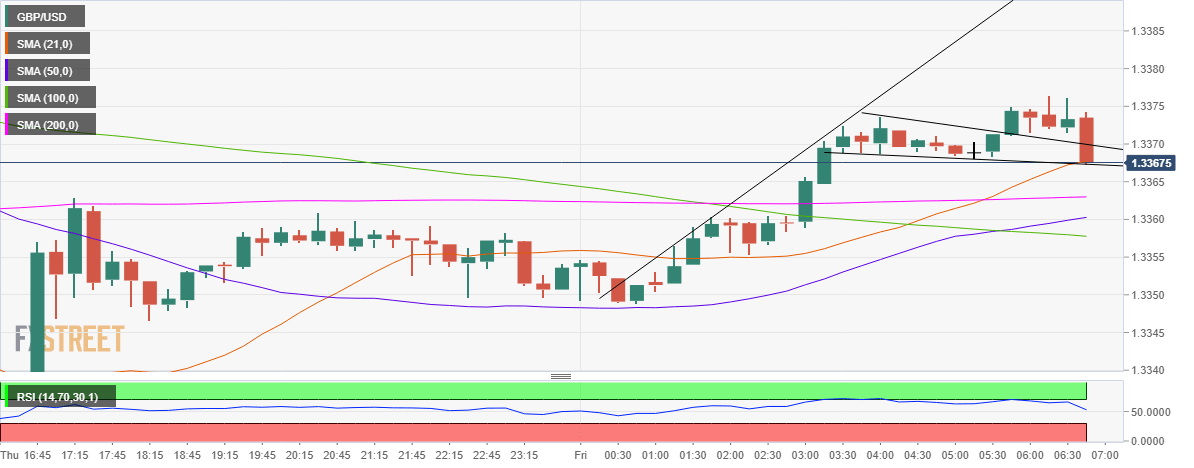
- The spot charted a bull pennant on the 15-minutes chart.
- Bullish crossover and RSI add credence to the advance.
GBP/USD holds the higher ground heading into the European open, with the bulls looking to test the 1.3400 level amid favorable technicals and broad-based US dollar weakness.
From a near-term technical perspective, the spot is consolidating the upside following a breakout from a bull pennant confirmed on the 15-minutes chart. The measured target is aligned at 1.3396.
The upside momentum gained traction after the 50-simple moving average (SMA) on the said timeframe crossed the 100-SMA from below, charting a bullish crossover.
The Relative Strength Index (RSI) has turned south but trades will above the 50.00 level, suggesting that the upside bias still remains intact.
The immediate support at 1.3367 could likely limit the retracement. Although a close below that level could invalidate the bullish formation.
The next support is then seen at the horizontal 200-SMA at 1.3363. The psychological level of 1.3350 could challenge the bears’ commitment.
GBP/USD: 15-minutes chart
GBP/USD: Additional levels