USD/CHF Price Analysis: Extends pullback from 50-day SMA to snap two-day uptrend
- USD/CHF wavers around intraday low following failures to recover beyond 0.9131.
- Normal RSI conditions suggest further weakness, two-month-old falling trend line adds to the upside filters.
USD/CHF drops to 0.9120, down 0.08% intraday, during the pre-European session trading on Tuesday. The pair rose to the highest in one week the previous day, before taking a U-turn from 0.9148.
With the normal RSI conditions backing the losses from 50-day SMA, sellers are likely targeting the 0.9100 threshold during further downside.
In a case where the USD/CHF bears dominate past-0.9100, the lows marked in October and the current month’s bottom, respectively around 0.9030 and 0.8980 can return to the charts.
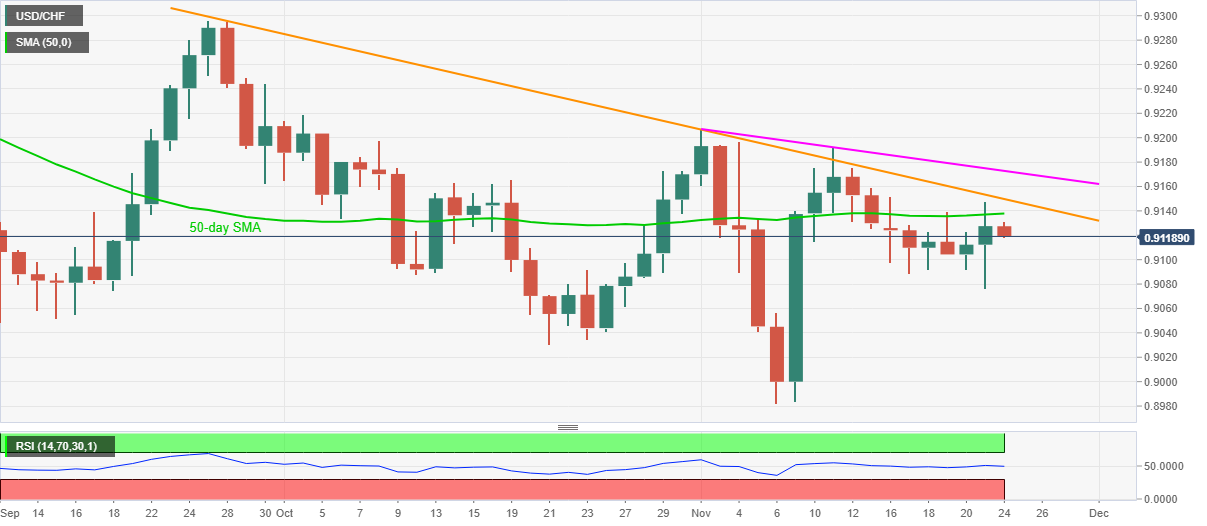
Meanwhile, an upside break beyond the 50-day SMA level of 0.9137 doesn’t guarantee the quote’s run-up as a multi-day-old falling resistance line, currently around 0.9150, challenges the USD/CHF buyers.
Also acting as an additional hurdle to the north is another trend line resistance, from November 02, that presently stay near 0.9172.
USD/CHF daily chart
Trend: Further weakness expected