GBP/USD Price Analysis: Refreshes session lows, around 1.3230 region
- GBP/USD stalled its positive momentum near a two-month-old ascending channel resistance.
- Any subsequent dip might still be seen as a buying opportunity near the 1.3100 round-figure.
- A sustained move beyond the channel hurdle will set the stage for additional near-term gains.
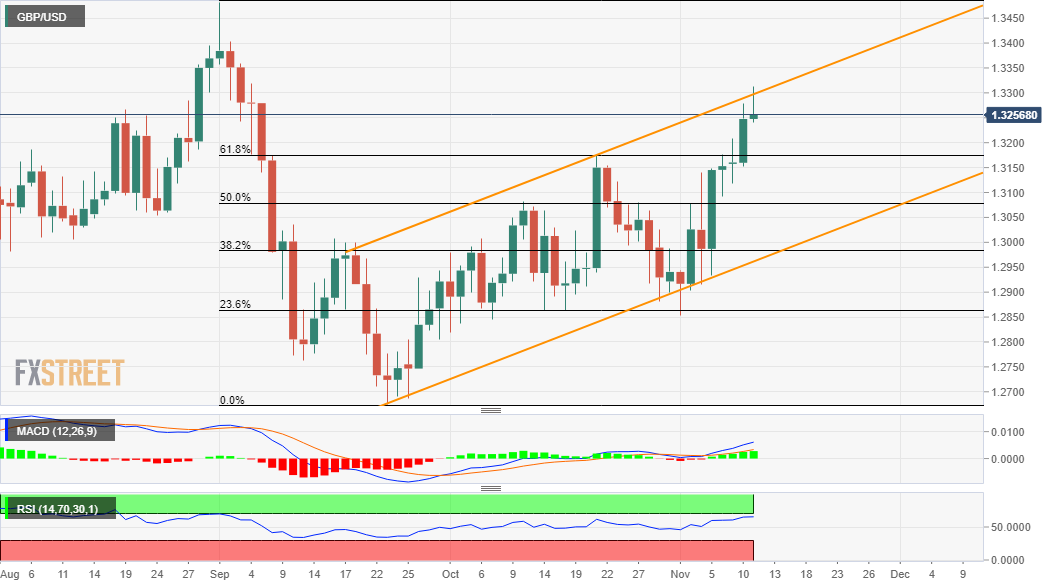
The GBP/USD pair stalled its recent bullish trajectory to fresh two-month tops and witnessed a modest intraday pullback from the 1.3310-15 area. The mentioned region marks the top boundary of an upward sloping channel extending from mid-September and should now act as a key pivotal point for short-term traders.
The GBP/USD pair dropped to fresh session lows, around the 1.3230 region in the last hour, though any subsequent fall is more likely to attract some dip-buying near the 1.3200 mark. This should help limit the downside near the 1.3180-75 resistance breakpoint, representing the 61.8% Fibonacci level of the 1.3482-1.2676 slide.
That said, some follow-through selling below the 1.3150-40 horizontal level will negate prospects for any further appreciating move, instead prompt some technical selling. The GBP/USD pair might then accelerate the corrective slide towards the 1.3100 mark en-route the 50% Fibo. level support, around the 1.3075 zone.
On the flip side, the 1.3300 mark now seems to cap the immediate upside and is closely followed by the trend-line resistance. A sustained strength beyond will be seen as a fresh trigger for bullish traders and pave the way for a further appreciating move towards September daily closing highs resistance near the 1.3385 region.
GBP/USD daily chart
Technical levels to watch