GBP/USD Price Analysis: On the verge of a falling wedge breakout ahead of US election
- GBP/USD eyes a firm break above 1.2933 for bulls to take over.
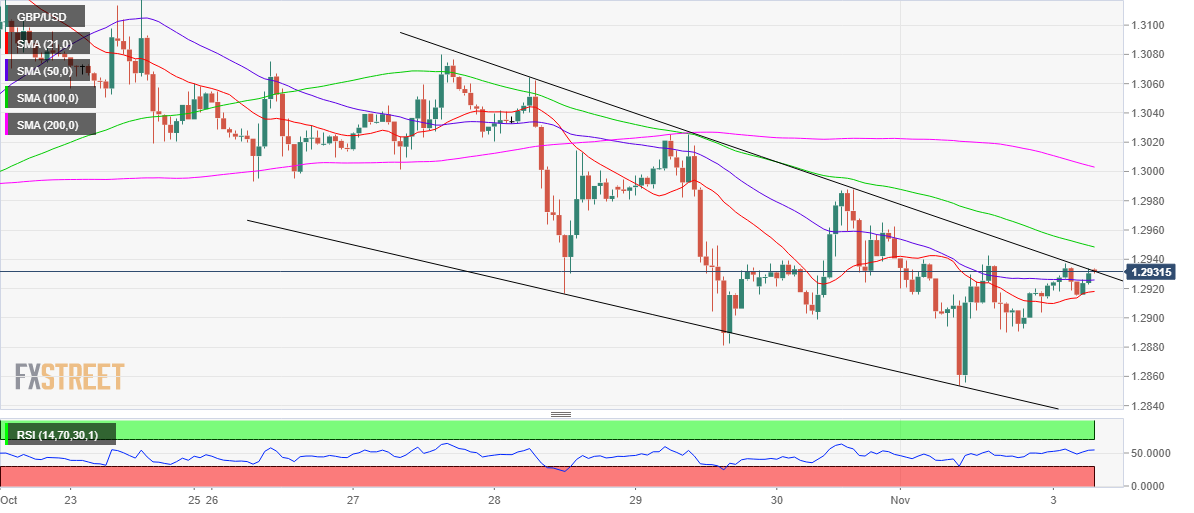
- Potential falling wedge formation spotted on the hourly chart.
- Hourly RSI stays bullish, as all eyes remain on the US election.
GBP/USD is consolidating the recovery from near-monthly lows of 1.2855, as the bulls await a fresh impetus on the 1.2900 level for the next push higher.
Broad-based US dollar weakness amid the upbeat market mood continues to underpin the cable, as markets stay focused on the US election while putting aside the Brexit and the UK lockdown worries.
From a near-term technical perspective, the path of least resistance appears to the upside, as the price is teasing a falling wedge pattern on the hourly sticks.
An hourly closing above the falling trendline resistance of 1.2933 is needed to extend the recovery momentum. The Relative Strength Index (RSI) inches higher, currently at 54.55, allowing more for the upside.
Bullish confirmation could fuel a run towards the bearish 100-hourly moving average (HMA) at 1.2948, above which the 200-HMA at 1.3003 could likely come into play.
Alternatively, a break below immediate support at the horizontal 100-HMA of 1.2925 could expose the 21-HMA cap at 1.2918, which is the line in the sand for the bulls.
Acceptance below the latter could recall the multi-week lows around mid-1.2800s.
GBP/USD: Hourly chart
GBP/USD: Additional levels