22 Oct 2020
US Dollar Index Price Analysis: Interim resistance emerges at 93.30/50
- DXY bounces off fresh lows in the 92.50/45 band on Thursday.
- Next on the upside aligns the 93.30/50 band.
DXY regains some composure after bottoming out in the 92.50/45 band (Wednesday), or fresh multi-week lows.
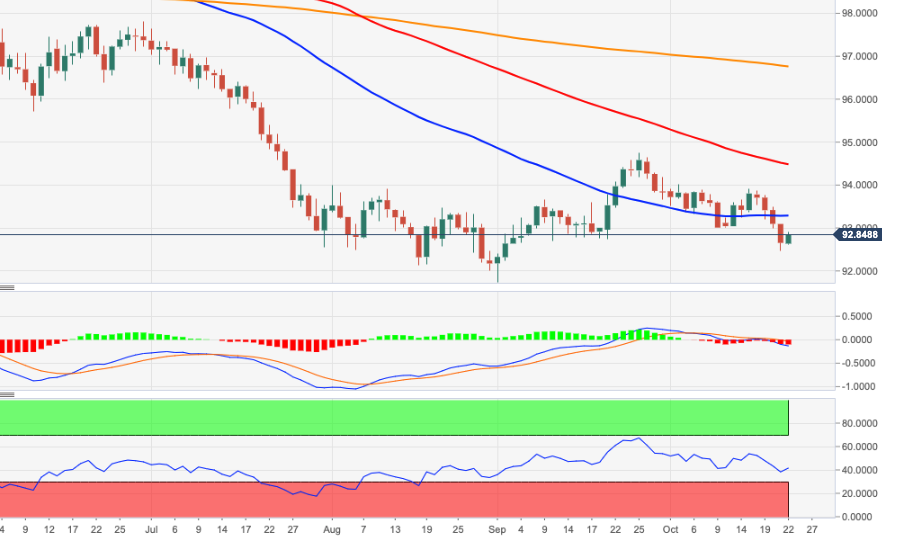
If the ongoing bullish attempt gathers further steam, then the next interim hurdle emerges at the 55-day SMA near 93.30 ahead of the 6-month resistance line around 93.50. Further up is located last week’s highs near 93.80.
While below the 200-day SMA, today at 96.75, the negative view on the dollar is expected to persist.
DXY daily chart