GBP/USD Price Analysis: Monday’s hanging man keep sellers hopeful above 1.3350
- GBP/USD extends pullback from the early high of 1.3395 amid overbought RSI.
- Bearish candlestick formation can benefit from the break of one-month-old support (previous resistance).
- Bulls will have to cross 1.3400 to retake the controls.
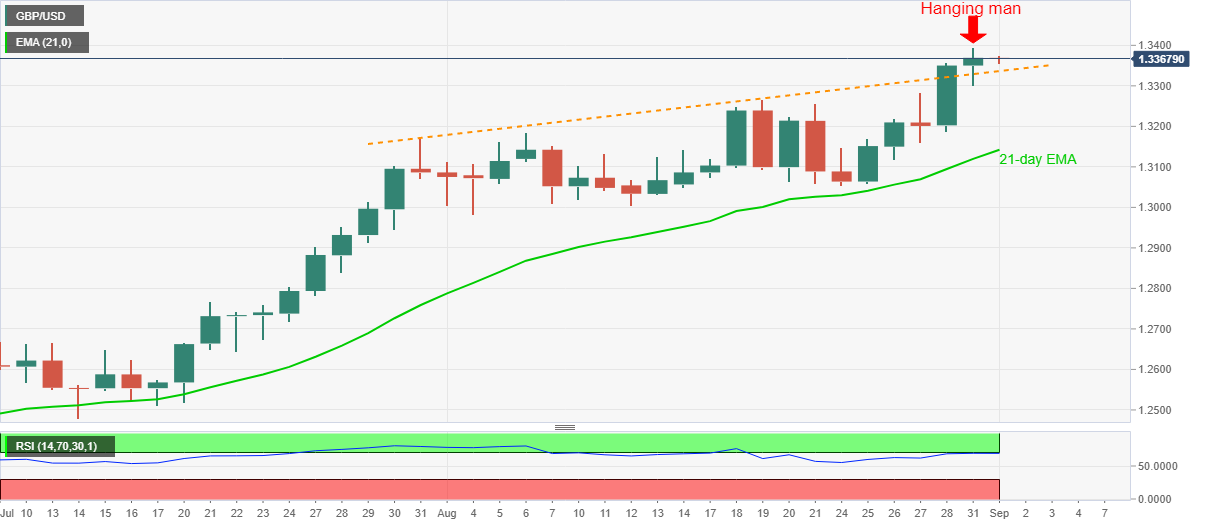
GBP/USD refreshes the intraday low to 1.3358, down 0.08% on a day, during Tuesday’s Asian session. The Cable surged the fresh high since late-December 2019 the previous day. However, the failures to stay strong near the multi-month top printed a bearish candlestick on the daily chart. Also increasing the odds of further downside is the overbought conditions of RSI.
Even so, the sellers are waiting for a clear downside below an ascending trend line from July 31, currently around 1.3345, for fresh entries.
In doing so, the August 19 top near 1.3265 and 21-day EMA level of 1.3142 will be on their radars.
Alternatively, the pair needs to cross 1.3400 round-figures to defy the previous day’s candlestick formation and challenge December 2019 peak surrounding 1.3515.
GBP/USD daily chart
Trend: Pullback expected