USD/CAD Price Analysis: Bulls eye weekly descending triangle confirmation above 1.3200
- USD/CAD eases from the resistance line of a short-term bullish chart formation.
- 100 and 200 HMAs add to the upside filters.
- A downside break below 1.3190 will recall the bears targeting 1.3100.
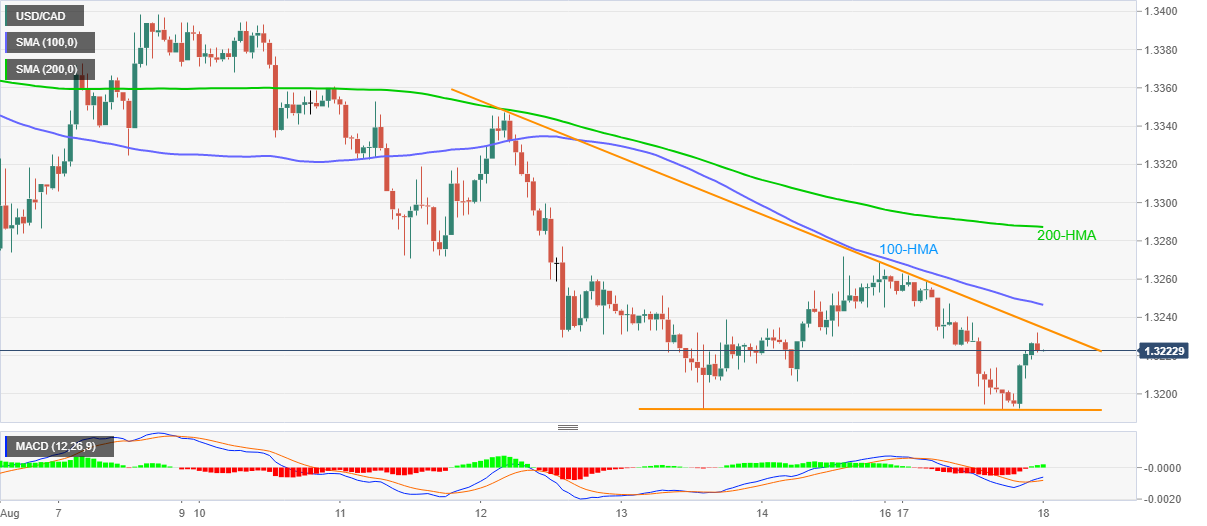
USD/CAD fades upside momentum while easing to 1.3222 during the pre-Tokyo open Asian trading on Tuesday. The loonie pair portrays a descending triangle formation following the previous day’s bounce off 1.3192. Also increasing the odds of its upside is the MACD histogram that teases the bulls.
However, a clear break beyond the said formation’s resistance near 1.3235 becomes necessary for the pair to confirm further upside. In doing so, 100-HMA and 200-HMAs, respectively around 1.3250 and 1.3290, will be on the buyers’ radars.
In a case where the pair manages to cross 1.3290, 1.3350 and August 07 peak surrounding 1.3400 could return to the charts.
Alternatively, a downside break of the bullish formation’s support near 1.3190 will not only disappoint the optimists but will also strengthen the bears to attack 1.3100 mark comprising late-December 2019 low and January 09, 2020, top.
USD/CAD hourly chart
Trend: Pullback expected