NZD/USD Price Analysis: Break of 0.6550 can confirm falling wedge on 4-hour chart
- NZD/USD trims early-day losses while bouncing off 0.6529.
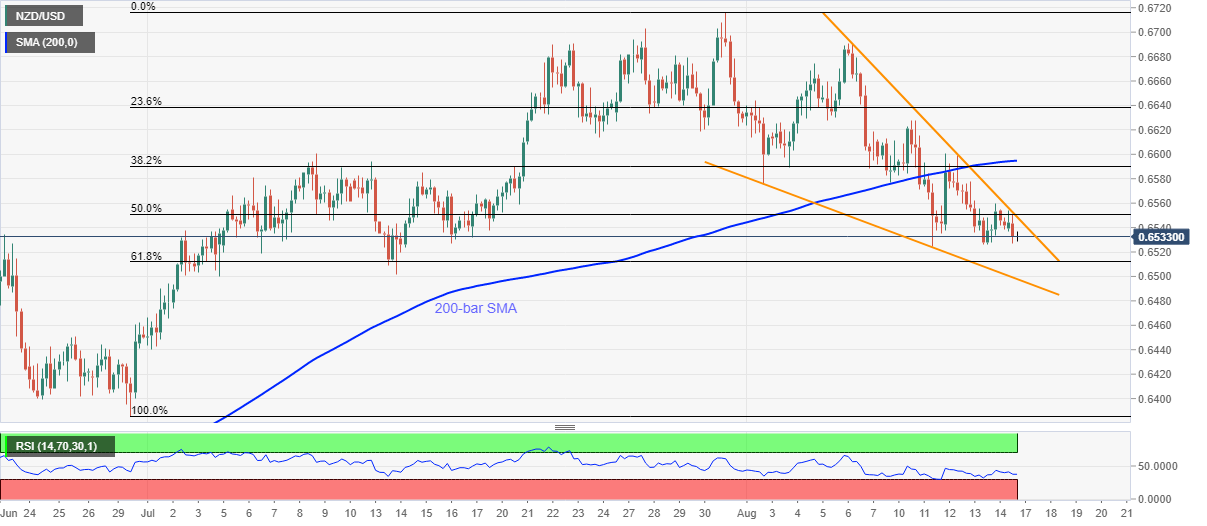
- The bullish pattern’s break will target 200-bar SMA as immediate resistance.
- 61.8% of Fibonacci retracement can offer nearby support during further declines.
NZD/USD picks up the bids near 0.6535, down 0.10% on a day, ahead of the European session on Monday. The kiwi pair earlier dropped amid political uncertainty at New Zealand (NZ) after the government delayed the general election following the coronavirus (COVID-19) resurgence. However, the latest comments from NZ Finance Minister Grant Robertson seems to have underpinned the quote’s pullback moves.
Even so, the resistance line of a two-week-old falling wedge joins 50% Fibonacci retracement of June 30 to July 31 upside while highlighting 0.6550 as the key upside barrier.
While a clear break of 0.6550 will confirm the theoretical bull-run towards crossing 0.6800, 200-bar SMA near 0.6600 and the monthly top near 0.6715 will add filters to the north-run.
Alternatively, 61.8% Fibonacci retracement level of 0.6510 precedes the mentioned pattern’s support, at 0.6500 now, to restrict the quote’s immediate downside.
In a case where the bears keep the reins past-0.6500, June 26 high close to 0.64540 will in the spotlight.
NZD/USD four-hour chart
Trend: Further recovery expected