WTI Price Analysis: Stays depressed below 200-day EMA
- WTI defies the pullback from $40.93 by reversing from $41.37.
- A confluence of 21-day EMA, monthly support line grabs the sellers’ attention.
- Bulls will have to refresh the monthly top before attacking February month’s low.
WTI remains on the back foot around $41.05, down 0.25% on a day, while heading into Wednesday’s European session. The energy benchmark took a U-turn from 200-day EMA the previous day. This marked the black gold’s sustained trading below the key EMA for the fourth day in a raw.
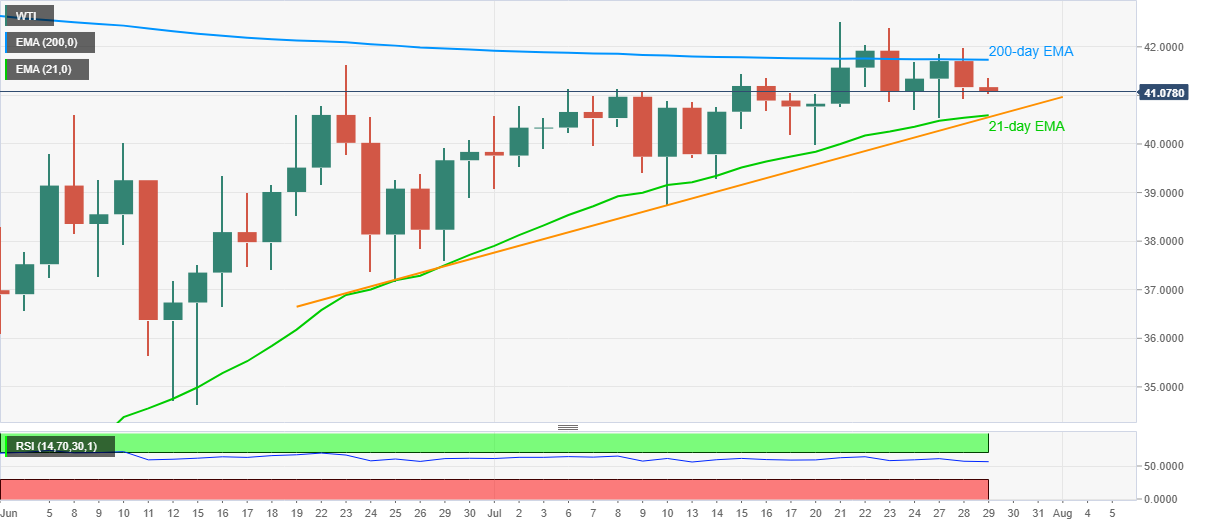
The same could be compared to the quote’s inability to stay positive above $42.00 to anticipate further downside. As a result, 21-day EMA and an upward sloping trend line from June 25, currently around $40.60/55, becomes the key to watch.
Should oil prices decline below $40.55 on a daily chart, $40.00 may offer an intermediate halt during the fall towards the month’s low near $38.70.
On the contrary, an upside clearance of 200-day EMA level of $41.73 will not only need a sustained break above $42.00 but should also break the monthly peak of $42.52 to aim for February month’s low near $44.00.
WTI daily chart
Trend: Further weakness expected