AUD/NZD Price Analysis: Eyes head-and-shoulders neckline support
- AUD/NZD charts head-and-shoulders pattern on the daily chart.
- Daily chart indicators favor a drop to the neckline support.
AUD/NZD is reporting marginal gains at press time amid signs of bearish exhaustion on the 4-hour chart. The daily chart, however, remains biased in favor of the bears.
The pair is currently trading at 1.0623, up 0.10% on the day. The consecutive Doji candles on the 4-hour chart suggest a temporary weakening of bearish pressures. As such, a stronger bounce cannot be ruled out.
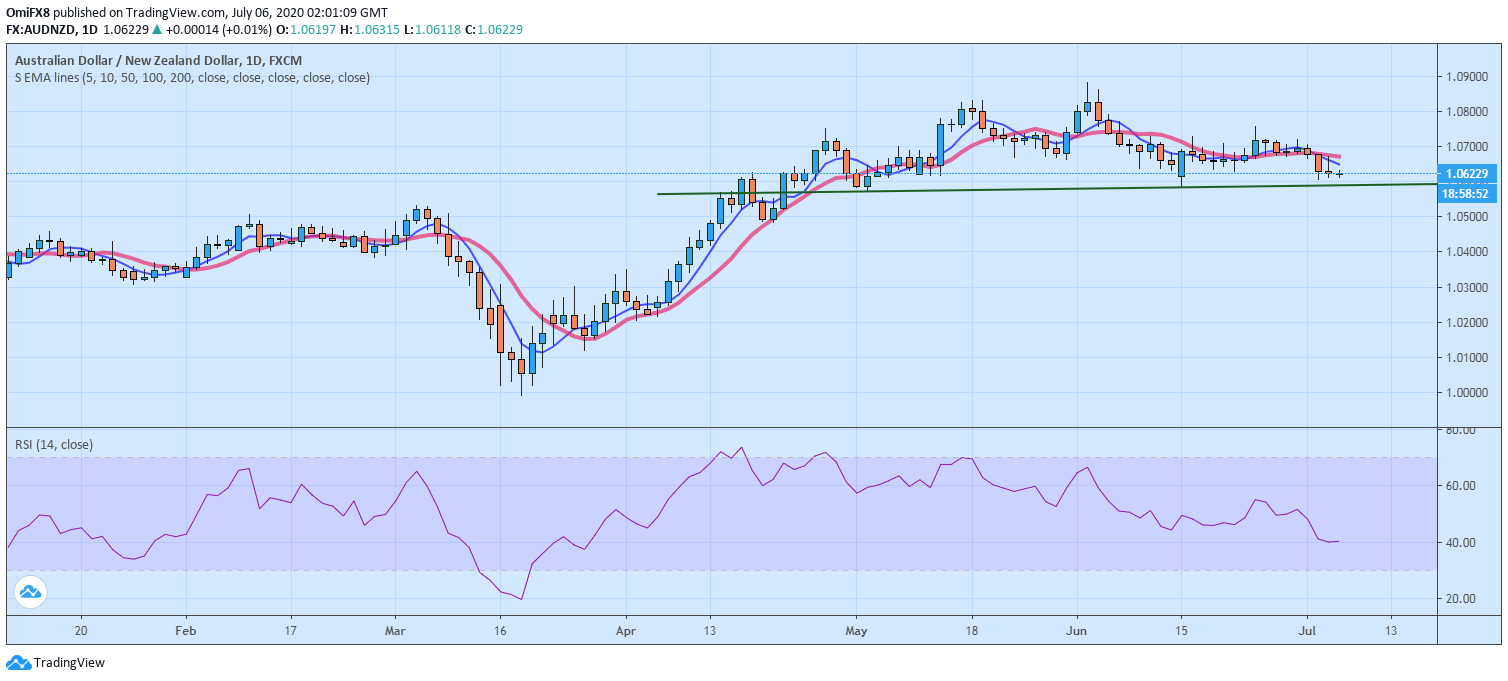
However, with the 14-day relative strength index hovering in bearish territory below 50 and the 5- and 10-day simple moving averages trending south, the upside looks limited and could end up recharging engines for a drop toward support at 1.0586. That level is housing the neckline support of the head-and-shoulders (H&S) pattern seen on the daily chart.
A daily close under 1.0586 would confirm the H&S breakdown and open the doors to 1.03 (target as per the measured move method).
Meanwhile, a close above Friday's high of 1.0670 is needed to invalidate the immediate bearish outlook.
Daily chart
Trend: Bearish
Pivot points